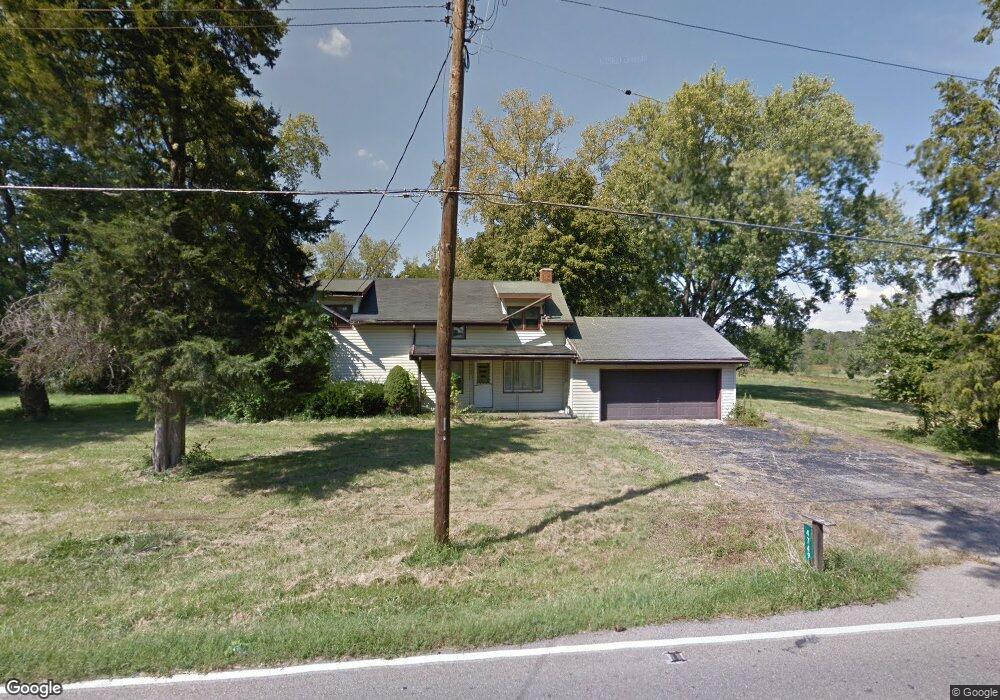
4749 Union Rd Franklin, OH 45005
Estimated Value: $277,000 - $406,146
3
Beds
1
Bath
1,760
Sq Ft
$185/Sq Ft
Est. Value
About This Home
This home is located at 4749 Union Rd, Franklin, OH 45005 and is currently estimated at $326,037, approximately $185 per square foot. 4749 Union Rd is a home located in Warren County with nearby schools including Franklin High School, Summit Academy Community School for Alternative Learners - Middletown, and Marshall High School.
Ownership History
Date
Name
Owned For
Owner Type
Purchase Details
Closed on
Nov 27, 2023
Sold by
Moreland Family Trust
Bought by
Moreland Legacy Properties Llc
Current Estimated Value
Purchase Details
Closed on
Mar 29, 2019
Sold by
Moreland James E and Moreland Jim
Bought by
Moreland Family Trust
Purchase Details
Closed on
Aug 4, 2018
Sold by
Moreland Majorie
Bought by
Moreland James E
Purchase Details
Closed on
Sep 8, 2015
Sold by
Moreland Melissa
Bought by
Moreland James E
Purchase Details
Closed on
May 28, 2008
Sold by
Estate Of Dan E Moreland
Bought by
Moreland Marjorie Ann
Purchase Details
Closed on
Aug 24, 2006
Sold by
Estate Of Irene E Moreland
Bought by
Moreland Melissa Ann and Moreland James E
Create a Home Valuation Report for This Property
The Home Valuation Report is an in-depth analysis detailing your home's value as well as a comparison with similar homes in the area
Home Values in the Area
Average Home Value in this Area
Purchase History
| Date | Buyer | Sale Price | Title Company |
|---|---|---|---|
| Moreland Legacy Properties Llc | -- | None Listed On Document | |
| Moreland Family Trust | -- | None Available | |
| Moreland James E | $25,000 | None Available | |
| Moreland James E | -- | None Available | |
| Moreland James E | -- | Attorney | |
| Moreland Marjorie Ann | -- | None Available | |
| Moreland Melissa Ann | -- | None Available |
Source: Public Records
Tax History
| Year | Tax Paid | Tax Assessment Tax Assessment Total Assessment is a certain percentage of the fair market value that is determined by local assessors to be the total taxable value of land and additions on the property. | Land | Improvement |
|---|---|---|---|---|
| 2025 | $4,429 | $99,900 | $57,560 | $42,340 |
| 2024 | $4,429 | $99,900 | $57,560 | $42,340 |
| 2023 | $3,694 | $73,976 | $36,463 | $37,513 |
| 2022 | $3,614 | $73,976 | $36,463 | $37,513 |
| 2021 | $3,410 | $73,976 | $36,463 | $37,513 |
| 2020 | $3,152 | $60,144 | $29,645 | $30,499 |
| 2019 | $2,852 | $60,144 | $29,645 | $30,499 |
| 2018 | $2,857 | $60,144 | $29,645 | $30,499 |
| 2017 | $2,716 | $52,031 | $24,605 | $27,426 |
| 2016 | $2,774 | $52,031 | $24,605 | $27,426 |
| 2015 | $2,775 | $52,031 | $24,605 | $27,426 |
| 2014 | $2,645 | $48,360 | $23,650 | $24,710 |
| 2013 | $2,258 | $55,370 | $25,470 | $29,900 |
Source: Public Records
Map
Nearby Homes
- 6334 Bevis Ln
- 5744 Lynn St
- 5845 Manchester Rd
- 4566 S Dixie Hwy
- 4640 Shaker Rd
- 4650 Shaker Rd
- 6759 Manchester Rd
- 5757 S Dixie Hwy
- 6610 Washington Cir Unit 226
- 0 S Dixie Hwy Unit 933134
- 6777 Crystal Harbour Dr
- 5001 Central Ave
- 5696 Woodcreek Dr
- 6763 Washington Cir
- 5667 Woodcreek Dr
- 25 Timber Creek Dr
- 65 Timber Creek Dr
- 5865 Hayden Dr
- 6006 Tributary Park
- 3833 Sterling Dr
- 4734 Union Rd
- 4710 Union Rd
- 4803 Union Rd
- 4679 Moreland Dr
- 4680 Union Rd
- 4680 Moreland Dr
- 4842 Moreland Dr
- 4700 Moreland Dr
- 4855 Union Rd
- 4681 Moreland Dr
- 4636 Union Rd
- 4656 Union Rd
- 4718 Moreland Dr
- 4828 Moreland Dr
- 4792 Moreland Dr
- 4868 Union Rd
- 4810 Moreland Dr
- 4734 Moreland Dr
- 4875 Union Rd
- 4609 Union Rd
Your Personal Tour Guide
Ask me questions while you tour the home.