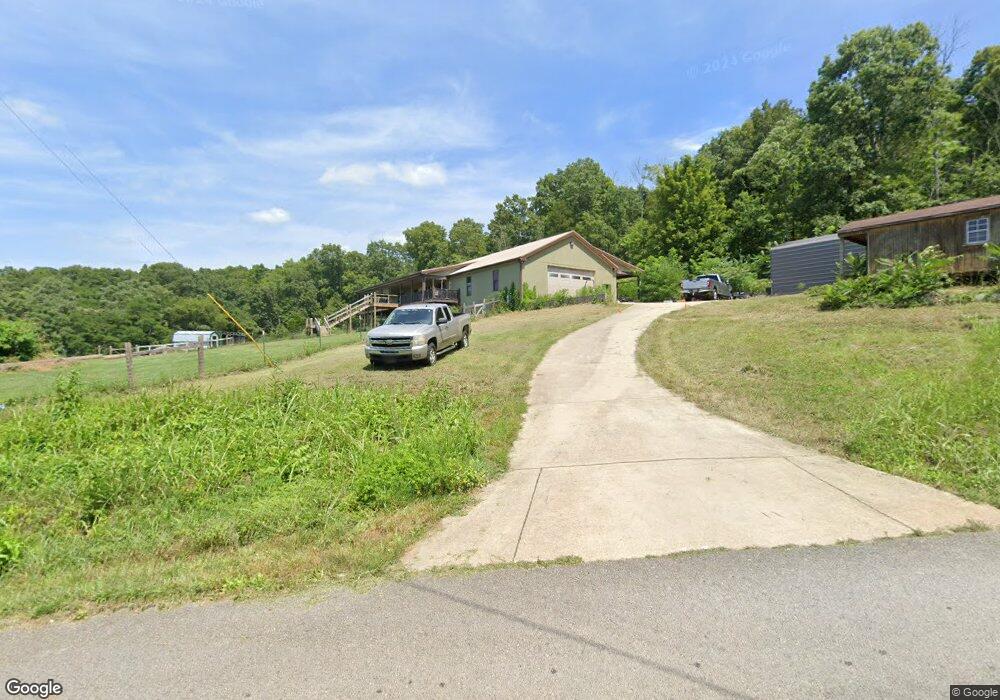
475 Blackburn Mountain Rd Sparta, TN 38583
Estimated Value: $317,000 - $582,000
3
Beds
2
Baths
2,100
Sq Ft
$235/Sq Ft
Est. Value
About This Home
This home is located at 475 Blackburn Mountain Rd, Sparta, TN 38583 and is currently estimated at $493,617, approximately $235 per square foot. 475 Blackburn Mountain Rd is a home located in White County with nearby schools including Woodland Park Elementary School, White County Middle School, and White County High School.
Ownership History
Date
Name
Owned For
Owner Type
Purchase Details
Closed on
Jun 12, 2014
Sold by
Randall Scott J
Bought by
Duke Gary W and Duke Valerie R
Current Estimated Value
Purchase Details
Closed on
Nov 21, 2013
Sold by
Duke Valerie
Bought by
Duke Valerie and Duke Gary W
Purchase Details
Closed on
Nov 14, 2011
Sold by
Jenson Daniel L
Bought by
Fettig Valerie
Purchase Details
Closed on
Mar 30, 2007
Sold by
Tillitson Key
Bought by
Fettig Valerie A
Purchase Details
Closed on
Mar 14, 2007
Purchase Details
Closed on
Jun 28, 2006
Purchase Details
Closed on
Dec 8, 2003
Purchase Details
Closed on
May 16, 2003
Sold by
Arl Brasel
Bought by
Tillitosn Key
Purchase Details
Closed on
Oct 24, 2002
Sold by
Michael Brasel
Bought by
Arl Brasel
Purchase Details
Closed on
Nov 2, 2000
Bought by
Brasel Michael
Create a Home Valuation Report for This Property
The Home Valuation Report is an in-depth analysis detailing your home's value as well as a comparison with similar homes in the area
Home Values in the Area
Average Home Value in this Area
Purchase History
| Date | Buyer | Sale Price | Title Company |
|---|---|---|---|
| Duke Gary W | $15,000 | -- | |
| Duke Valerie | -- | -- | |
| Fettig Valerie | -- | -- | |
| Fettig Valerie A | $137,000 | -- | |
| -- | -- | -- | |
| -- | -- | -- | |
| -- | $3,500 | -- | |
| Tillitosn Key | $18,700 | -- | |
| Arl Brasel | $5,000 | -- | |
| Brasel Michael | $60,000 | -- |
Source: Public Records
Mortgage History
| Date | Status | Borrower | Loan Amount |
|---|---|---|---|
| Previous Owner | Brasel Michael | $130,150 |
Source: Public Records
Tax History Compared to Growth
Tax History
| Year | Tax Paid | Tax Assessment Tax Assessment Total Assessment is a certain percentage of the fair market value that is determined by local assessors to be the total taxable value of land and additions on the property. | Land | Improvement |
|---|---|---|---|---|
| 2025 | $1,456 | $123,950 | $0 | $0 |
| 2024 | $1,456 | $71,025 | $5,900 | $65,125 |
| 2023 | $1,456 | $71,025 | $5,900 | $65,125 |
| 2022 | $1,456 | $71,025 | $5,900 | $65,125 |
| 2021 | $1,456 | $71,025 | $5,900 | $65,125 |
| 2020 | $1,456 | $71,025 | $5,900 | $65,125 |
| 2019 | $1,251 | $61,025 | $5,250 | $55,775 |
| 2018 | $1,251 | $61,025 | $5,250 | $55,775 |
| 2017 | $1,251 | $61,025 | $5,250 | $55,775 |
| 2016 | $1,078 | $61,025 | $5,250 | $55,775 |
| 2015 | $254 | $13,725 | $5,250 | $8,475 |
| 2014 | -- | $13,725 | $5,250 | $8,475 |
| 2013 | -- | $16,350 | $4,300 | $12,050 |
Source: Public Records
Map
Nearby Homes
- 171 Overlook Dr
- 0 Big Bottom Rd Unit RTC2762488
- 177 Hidden River Ave
- 179 River Front Dr
- 253 River Front Dr
- 0 Hidden River Ave Unit 1323479
- 0 Cane Creek-Cummingsville Rd
- Lot 1 Rd
- Lot 5 Hwy 285 Cane Creek - Cummingsville Rd
- Lot 4 Hwy 285 Cane Creek - Cummingsville Rd
- 77 River Front Dr
- 1.85 AC Cane Creek-Cummingsville Rd
- 185 Cane Creek-Cummingsville Rd
- 4134 Hickory Valley Rd
- 70 River Oaks Dr
- 88 River Oaks Dr
- 263 River Oaks Dr
- 523 Doctor I C Morgan Rd
- 459 Doctor I C Morgan Rd
- 138 Falls View Rd
- 523 Blackburn Mountain Rd
- 240 Overlook Dr
- 562 Blackburn Mountain Rd
- 372 Blackburn Mountain Rd
- 405 Overlook Dr
- 381 Ac Overlook Dr
- 536 Butts Bridge Rd
- 200 Overlook Dr
- 00 Overlook Dr
- 31 Overlook Dr
- 5.91 ACR Overlook Dr
- 758 Blackburn Mountain Rd
- 215 Overlook Dr
- 7251 Hickory Valley Rd
- 545 Butts Bridge Rd
- 418 Butts Bridge Rd
- 7303 Hickory Valley Rd
- 325 Overlook Dr
- 308 Overlook Dr
- 7235 Hickory Valley Rd