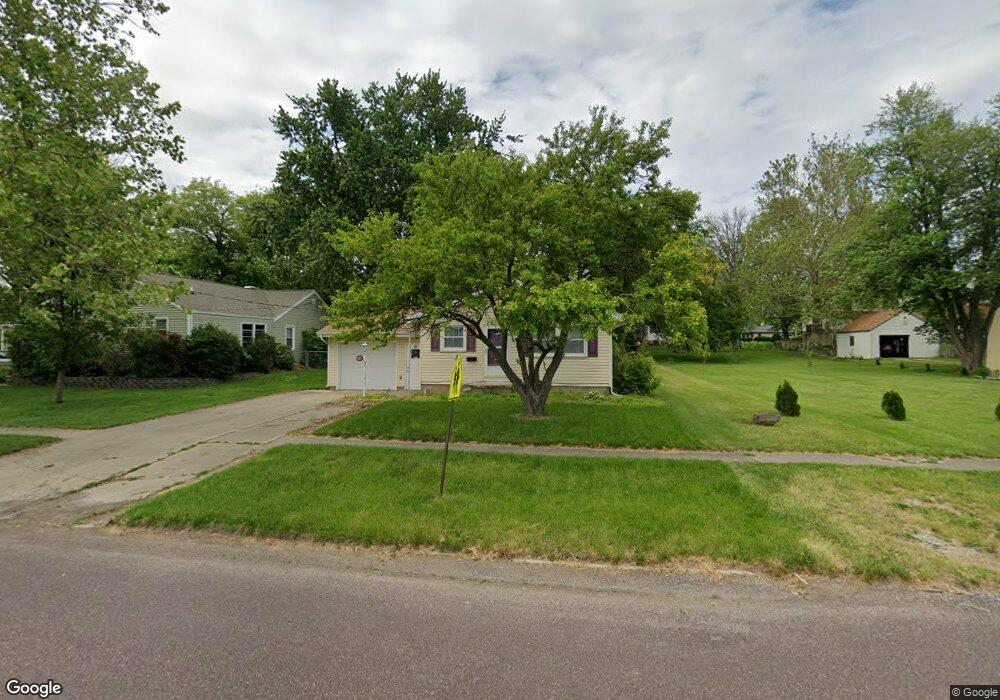
475 E Front St El Paso, IL 61738
Estimated Value: $137,000 - $157,000
2
Beds
1
Bath
960
Sq Ft
$152/Sq Ft
Est. Value
About This Home
This home is located at 475 E Front St, El Paso, IL 61738 and is currently estimated at $145,987, approximately $152 per square foot. 475 E Front St is a home located in Woodford County with nearby schools including El Paso-Gridley High School.
Ownership History
Date
Name
Owned For
Owner Type
Purchase Details
Closed on
Sep 25, 2023
Sold by
Mcbride Carol R
Bought by
See Victoria E and Allen Jacon T
Current Estimated Value
Home Financials for this Owner
Home Financials are based on the most recent Mortgage that was taken out on this home.
Original Mortgage
$6,000
Interest Rate
6.96%
Mortgage Type
New Conventional
Create a Home Valuation Report for This Property
The Home Valuation Report is an in-depth analysis detailing your home's value as well as a comparison with similar homes in the area
Home Values in the Area
Average Home Value in this Area
Purchase History
| Date | Buyer | Sale Price | Title Company |
|---|---|---|---|
| See Victoria E | $100,000 | Woodford County Title |
Source: Public Records
Mortgage History
| Date | Status | Borrower | Loan Amount |
|---|---|---|---|
| Closed | See Victoria E | $6,000 | |
| Closed | See Victoria E | $73,500 |
Source: Public Records
Tax History
| Year | Tax Paid | Tax Assessment Tax Assessment Total Assessment is a certain percentage of the fair market value that is determined by local assessors to be the total taxable value of land and additions on the property. | Land | Improvement |
|---|---|---|---|---|
| 2024 | $2,895 | $42,157 | $5,052 | $37,105 |
| 2023 | $2,662 | $38,338 | $4,594 | $33,744 |
| 2022 | $2,500 | $35,475 | $4,251 | $31,224 |
| 2021 | $2,359 | $33,498 | $4,014 | $29,484 |
| 2020 | $2,294 | $32,602 | $3,907 | $28,695 |
| 2019 | $2,236 | $32,602 | $3,907 | $28,695 |
| 2018 | $2,260 | $32,311 | $3,872 | $28,439 |
| 2017 | $2,244 | $31,991 | $3,834 | $28,157 |
| 2016 | $2,232 | $31,674 | $3,796 | $27,878 |
| 2015 | $2,183 | $30,775 | $3,688 | $27,087 |
| 2014 | $2,183 | $30,640 | $3,672 | $26,968 |
| 2013 | $2,183 | $30,355 | $3,638 | $26,717 |
Source: Public Records
Map
Nearby Homes
- 546 Elmwood Ct
- 225 N Pine St
- 321 E 2nd St
- 11 E 3rd St
- 35 W 5th St
- 2838 Saint Andrews Ct
- 0 Illinois 251
- 000 US Highway 24
- 2873 County Road 1600 N
- 15795 E 2550 North Rd
- 17539 E 2600 North Rd
- 000 Highway 24
- 207 E Field St
- 211 N 4th St
- 202 E Jones St
- 103 N 3rd St
- Lot 6 Gilman St
- 111 Gilman St
- 213 N 2nd St
- 108 E Gridley Rd
Your Personal Tour Guide
Ask me questions while you tour the home.