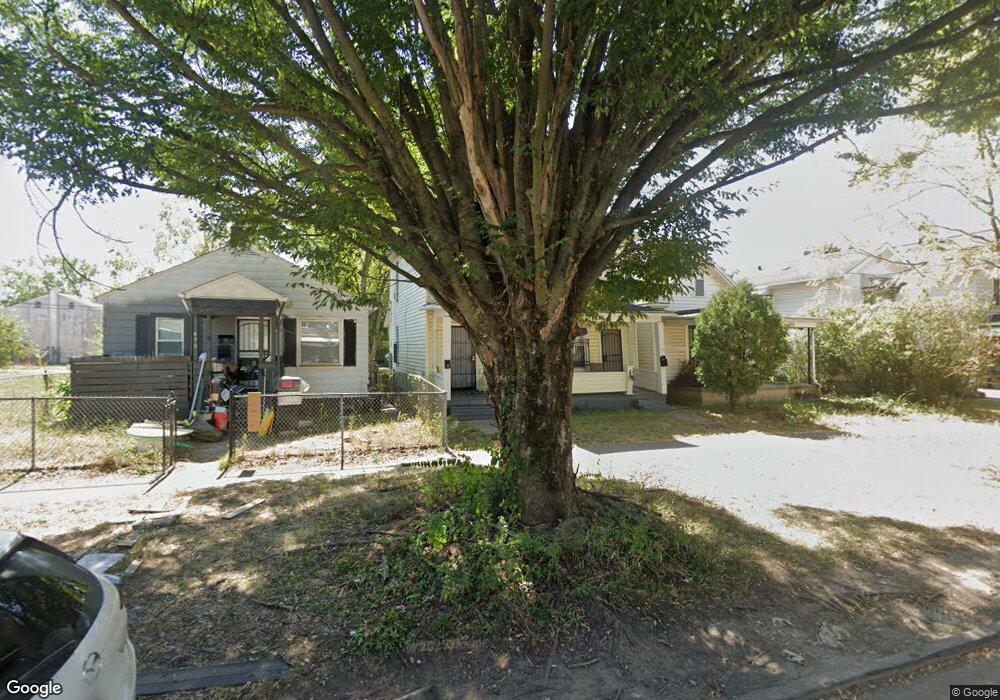
475 E Hinman Ave Unit 477 Columbus, OH 43207
Vassor Village NeighborhoodEstimated Value: $168,000 - $240,000
4
Beds
2
Baths
1,581
Sq Ft
$126/Sq Ft
Est. Value
About This Home
This home is located at 475 E Hinman Ave Unit 477, Columbus, OH 43207 and is currently estimated at $198,899, approximately $125 per square foot. 475 E Hinman Ave Unit 477 is a home located in Franklin County with nearby schools including Lincoln Park Elementary School, South High School, and South Columbus Preparatory Academy.
Ownership History
Date
Name
Owned For
Owner Type
Purchase Details
Closed on
May 13, 2002
Sold by
Pdp Inc
Bought by
Massa Kevin G
Current Estimated Value
Home Financials for this Owner
Home Financials are based on the most recent Mortgage that was taken out on this home.
Original Mortgage
$60,300
Outstanding Balance
$28,368
Interest Rate
9.2%
Mortgage Type
Purchase Money Mortgage
Estimated Equity
$170,531
Purchase Details
Closed on
Apr 19, 2002
Sold by
Rose Michael
Bought by
Pdp Inc
Home Financials for this Owner
Home Financials are based on the most recent Mortgage that was taken out on this home.
Original Mortgage
$60,300
Outstanding Balance
$28,368
Interest Rate
9.2%
Mortgage Type
Purchase Money Mortgage
Estimated Equity
$170,531
Purchase Details
Closed on
Nov 8, 1999
Sold by
Lewis William
Bought by
Rose Michael
Home Financials for this Owner
Home Financials are based on the most recent Mortgage that was taken out on this home.
Original Mortgage
$56,000
Interest Rate
7.72%
Purchase Details
Closed on
Apr 22, 1987
Bought by
Johnson Francis J
Create a Home Valuation Report for This Property
The Home Valuation Report is an in-depth analysis detailing your home's value as well as a comparison with similar homes in the area
Home Values in the Area
Average Home Value in this Area
Purchase History
| Date | Buyer | Sale Price | Title Company |
|---|---|---|---|
| Massa Kevin G | $67,000 | Assurance Title Agency Of Oh | |
| Pdp Inc | $36,100 | Independent Title | |
| Rose Michael | $80,000 | -- | |
| Lewis William | $41,000 | -- | |
| Johnson Francis J | $30,000 | -- |
Source: Public Records
Mortgage History
| Date | Status | Borrower | Loan Amount |
|---|---|---|---|
| Open | Massa Kevin G | $60,300 | |
| Closed | Pdp Inc | $60,300 | |
| Previous Owner | Rose Michael | $56,000 |
Source: Public Records
Tax History
| Year | Tax Paid | Tax Assessment Tax Assessment Total Assessment is a certain percentage of the fair market value that is determined by local assessors to be the total taxable value of land and additions on the property. | Land | Improvement |
|---|---|---|---|---|
| 2025 | $2,369 | $51,700 | $18,520 | $33,180 |
| 2024 | $2,369 | $51,700 | $18,520 | $33,180 |
| 2023 | $2,340 | $51,695 | $18,515 | $33,180 |
| 2022 | $1,204 | $22,650 | $4,130 | $18,520 |
| 2021 | $1,206 | $22,650 | $4,130 | $18,520 |
| 2020 | $1,208 | $22,650 | $4,130 | $18,520 |
| 2019 | $1,173 | $18,870 | $3,430 | $15,440 |
| 2018 | $1,097 | $18,870 | $3,430 | $15,440 |
| 2017 | $1,173 | $18,870 | $3,430 | $15,440 |
| 2016 | $1,122 | $16,520 | $2,940 | $13,580 |
| 2015 | $1,022 | $16,520 | $2,940 | $13,580 |
| 2014 | $1,024 | $16,520 | $2,940 | $13,580 |
| 2013 | $531 | $17,360 | $3,080 | $14,280 |
Source: Public Records
Map
Nearby Homes
- 464 E Hinman Ave
- 1696 Parsons Ave
- 1692 Parsons Ave
- 457 E Woodrow Ave Unit 459
- 1657 Ann St
- 495 E Welch Ave
- 379 E Morrill Ave
- 363 E Morrill Ave
- 366-368 E Morrill Ave
- 330 E Morrill Ave
- 531 Southwood Ave
- 69 E Woodrow Ave
- 1532 Parsons Ave
- 1624 S 8th St
- 601 Southwood Ave
- 605 Southwood Ave
- 402 Southwood Ave
- 513 E Jenkins Ave
- 610 Southwood Ave
- 301 Southwood Ave
- 473 E Hinman Ave
- 479 E Hinman Ave
- 467 E Hinman Ave
- 487 E Hinman Ave Unit 489
- 463 E Hinman Ave
- 487-489 E Hinman Ave
- 461 E Hinman Ave
- 491 E Hinman Ave Unit 493
- 491-493 E Hinman Ave
- 472 E Woodrow Ave
- 476 E Woodrow Ave
- 468 E Woodrow Ave
- 455 E Hinman Ave
- 0 E Hinman Ave
- 464 E Woodrow Ave
- 456 E Woodrow Ave
- 451 E Hinman Ave
- 499 E Hinman Ave
- 452 E Woodrow Ave
- 476 E Hinman Ave
Your Personal Tour Guide
Ask me questions while you tour the home.