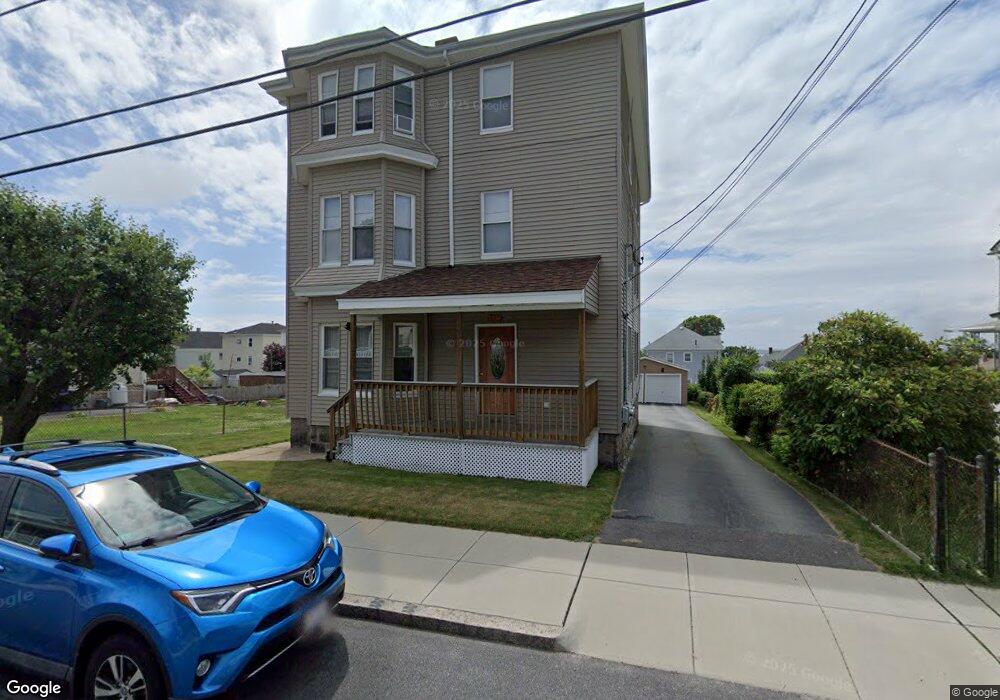
475 S Beach St Fall River, MA 02724
Sandy Beach NeighborhoodEstimated Value: $633,000 - $670,000
6
Beds
3
Baths
3,552
Sq Ft
$184/Sq Ft
Est. Value
About This Home
This home is located at 475 S Beach St, Fall River, MA 02724 and is currently estimated at $655,000, approximately $184 per square foot. 475 S Beach St is a home located in Bristol County with nearby schools including Carlton M. Viveiros Elementary School, Matthew J. Kuss Middle School, and B M C Durfee High School.
Ownership History
Date
Name
Owned For
Owner Type
Purchase Details
Closed on
Apr 19, 2021
Sold by
Rogers Jacqueline M
Bought by
Rogers David A and Rogers Lisa G
Current Estimated Value
Purchase Details
Closed on
Mar 12, 2021
Sold by
Rogers Jacqueline M
Bought by
Rogers Jacqueline M and Rogers David A
Purchase Details
Closed on
Dec 21, 1983
Bought by
Rogers Jacqueline M
Create a Home Valuation Report for This Property
The Home Valuation Report is an in-depth analysis detailing your home's value as well as a comparison with similar homes in the area
Home Values in the Area
Average Home Value in this Area
Purchase History
| Date | Buyer | Sale Price | Title Company |
|---|---|---|---|
| Rogers David A | -- | None Available | |
| Rogers Jacqueline M | -- | None Available | |
| Rogers Jacqueline M | -- | -- |
Source: Public Records
Mortgage History
| Date | Status | Borrower | Loan Amount |
|---|---|---|---|
| Previous Owner | Rogers Jacqueline M | $50,000 | |
| Previous Owner | Rogers Jacqueline M | $30,000 | |
| Previous Owner | Rogers Jacqueline M | $25,000 |
Source: Public Records
Tax History
| Year | Tax Paid | Tax Assessment Tax Assessment Total Assessment is a certain percentage of the fair market value that is determined by local assessors to be the total taxable value of land and additions on the property. | Land | Improvement |
|---|---|---|---|---|
| 2025 | $6,164 | $538,300 | $109,100 | $429,200 |
| 2024 | $5,898 | $513,300 | $105,100 | $408,200 |
| 2023 | $5,221 | $425,500 | $86,900 | $338,600 |
| 2022 | $4,645 | $368,100 | $82,700 | $285,400 |
| 2021 | $4,391 | $317,500 | $78,700 | $238,800 |
| 2020 | $3,948 | $273,200 | $77,600 | $195,600 |
| 2019 | $3,377 | $231,600 | $74,700 | $156,900 |
| 2018 | $3,251 | $222,400 | $80,900 | $141,500 |
| 2017 | $3,060 | $218,600 | $77,100 | $141,500 |
| 2016 | $3,000 | $220,100 | $82,000 | $138,100 |
| 2015 | $2,811 | $214,900 | $82,000 | $132,900 |
| 2014 | $2,825 | $224,600 | $79,600 | $145,000 |
Source: Public Records
Map
Nearby Homes
- 70 Brown St
- 1273-1279 S Main St
- 420 Bradford Ave
- 303 Eagle St Unit C
- 20 Wilcox St
- 1334 S Main St
- 403 Division St Unit 13
- 403 Division St Unit 5
- 403 Division St Unit 9
- 403 Division St Unit 11
- 403 Division St Unit 12
- 403 Division St Unit 1
- 403 Division St Unit 18
- 334 Fountain St
- 71 Mystic St Unit 3
- 700 Shore Dr Unit 6-604
- 700 Shore Dr Unit 1205
- 700 Shore Dr Unit 810
- 82 Montaup St
- 330 William St
- 459 S Beach St
- 495 S Beach St
- 584 S Almond St
- 584 S Almond St Unit 2
- 586 S Almond St Unit 2
- 574 S Almond St
- 451 S Beach St
- 598 S Almond St
- 564 S Almond St
- 511 S Beach St
- 466 S Beach St
- 550 S Almond St
- 435 S Beach St
- 458 S Beach St
- 458 S Beach St Unit 3
- 610 S Almond St
- 492 S Beach St
- 5 Oliver St
- 521 S Beach St
- 540 S Almond St Unit 1b
Your Personal Tour Guide
Ask me questions while you tour the home.