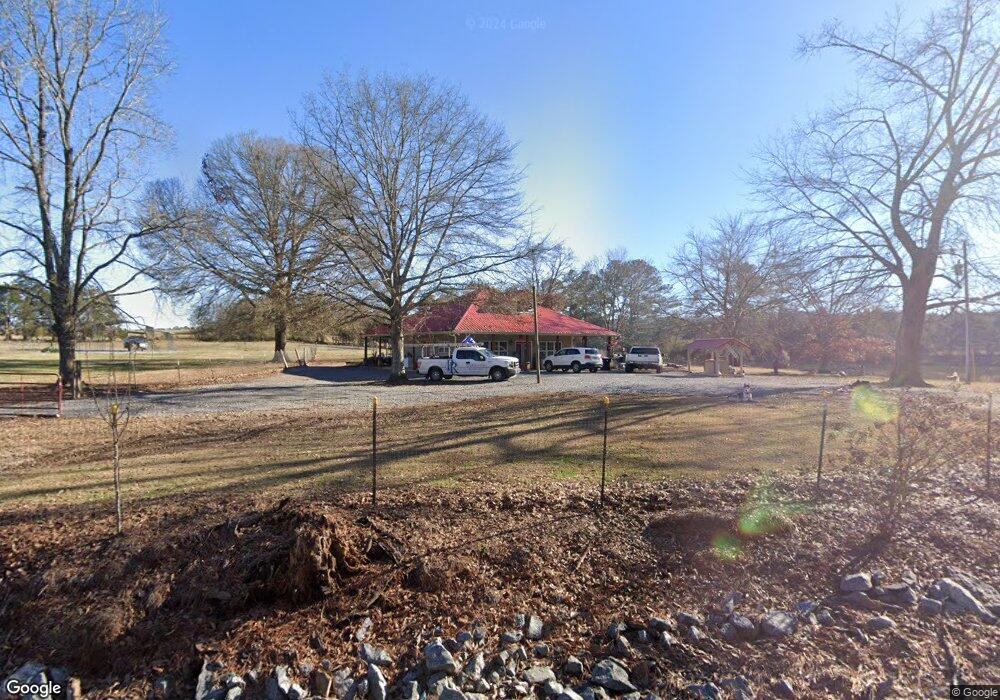
475 Wiley Rd Cedartown, GA 30125
Estimated Value: $270,850 - $560,000
2
Beds
2
Baths
1,156
Sq Ft
$336/Sq Ft
Est. Value
About This Home
This home is located at 475 Wiley Rd, Cedartown, GA 30125 and is currently estimated at $388,463, approximately $336 per square foot. 475 Wiley Rd is a home located in Polk County.
Ownership History
Date
Name
Owned For
Owner Type
Purchase Details
Closed on
May 21, 2021
Sold by
Ploof Windell Donald
Bought by
Ploof Windell Donald and Ploof Stacy
Current Estimated Value
Home Financials for this Owner
Home Financials are based on the most recent Mortgage that was taken out on this home.
Original Mortgage
$75,000
Outstanding Balance
$43,825
Interest Rate
3.1%
Mortgage Type
New Conventional
Estimated Equity
$344,638
Purchase Details
Closed on
Nov 13, 2009
Sold by
Ploof Windell Donald
Bought by
Ploof Windell Donald
Purchase Details
Closed on
Aug 28, 2009
Sold by
Ploof Donald Windell Sr*
Bought by
Ploof Windell Donald
Purchase Details
Closed on
Jan 9, 1995
Sold by
Jackson Jimmy Lee
Bought by
Ploof Donald W Sr Aka Donald W Ploo
Purchase Details
Closed on
Jul 22, 1985
Sold by
Ploof Donald W
Bought by
Jackson Jimmy Lee
Purchase Details
Closed on
Jul 21, 1985
Bought by
Ploof Donald W
Purchase Details
Closed on
Aug 11, 1983
Sold by
Ploof Donald W
Bought by
Ploof Donald W
Purchase Details
Closed on
Oct 1, 1976
Bought by
Ploof Donald and Ploof Judy
Create a Home Valuation Report for This Property
The Home Valuation Report is an in-depth analysis detailing your home's value as well as a comparison with similar homes in the area
Home Values in the Area
Average Home Value in this Area
Purchase History
| Date | Buyer | Sale Price | Title Company |
|---|---|---|---|
| Ploof Windell Donald | -- | -- | |
| Ploof Windell Donald | -- | -- | |
| Ploof Windell Donald | -- | -- | |
| Ploof Donald W Sr Aka Donald W Ploo | $60,000 | -- | |
| Jackson Jimmy Lee | -- | -- | |
| Ploof Donald W | -- | -- | |
| Ploof Donald W | -- | -- | |
| Ploof Donald | -- | -- |
Source: Public Records
Mortgage History
| Date | Status | Borrower | Loan Amount |
|---|---|---|---|
| Open | Ploof Windell Donald | $75,000 |
Source: Public Records
Tax History Compared to Growth
Tax History
| Year | Tax Paid | Tax Assessment Tax Assessment Total Assessment is a certain percentage of the fair market value that is determined by local assessors to be the total taxable value of land and additions on the property. | Land | Improvement |
|---|---|---|---|---|
| 2024 | $1,943 | $94,973 | $4,321 | $90,652 |
| 2023 | $1,500 | $65,194 | $4,321 | $60,873 |
| 2022 | $1,288 | $56,269 | $2,880 | $53,389 |
| 2021 | $1,305 | $56,269 | $2,880 | $53,389 |
| 2020 | $1,307 | $56,269 | $2,880 | $53,389 |
| 2019 | $149 | $5,530 | $2,880 | $2,650 |
| 2018 | $733 | $26,590 | $2,880 | $23,710 |
| 2017 | $724 | $26,590 | $2,880 | $23,710 |
| 2016 | $765 | $28,101 | $4,391 | $23,710 |
| 2015 | $770 | $28,194 | $4,391 | $23,802 |
| 2014 | $775 | $28,194 | $4,391 | $23,802 |
Source: Public Records
Map
Nearby Homes
- 1870 Tallapoosa Hwy
- 0 Culp Lake Rd (Tract 3)
- 0 Culp Lake Rd (Tract 2)
- 0 Culp Lake Rd Unit 1025-K 10390361
- 0 Culp Lake Rd Unit 1025-J 10390355
- 0 Culp Lake Rd Unit 1025-I 10390347
- 0 Culp Lake Rd Unit 1025-H 10390344
- 50 + - Acres Off Ga Hwy 78
- 812 Brewster Field Rd
- 0 Brewster Field Rd Unit 7664244
- 0 Brewster Field Rd Unit 10623054
- TR 2 Culp Lake Rd
- TR 3 Culp Lake Rd
- 745 Brewster Field Rd
- 525 Grogan Rd
- 539 Grogan Rd
- 557 Grogan Rd
- 2202 Treat Mountain Rd
- 4550 Buchanan Hwy
- 0 Akes Station Rd Unit 25208781
- 456 Wiley Rd
- 514 Wiley Rd
- 438 Wiley Rd
- 603 Wiley Rd
- 281 Fullwood Springs Rd
- 404 Wiley Rd
- 408 Wiley Rd
- 0 Fullwood Springs Rd Unit 8684293
- 0 Fullwood Springs Rd Unit 8167067
- 0 Fullwood Springs Rd
- 126 Fullwood Springs Rd
- 368 Wiley Rd
- 161 Wiley Rd
- 46 Fullwood Springs Rd
- 46 W 46 Fullwood Springs Rd S
- 46 W Fullwood Springs Rd S
- 222 Fullwood Springs Rd
- 157 Wiley Rd
- 455 Fullwood Springs Rd
- 221 Wiley Rd