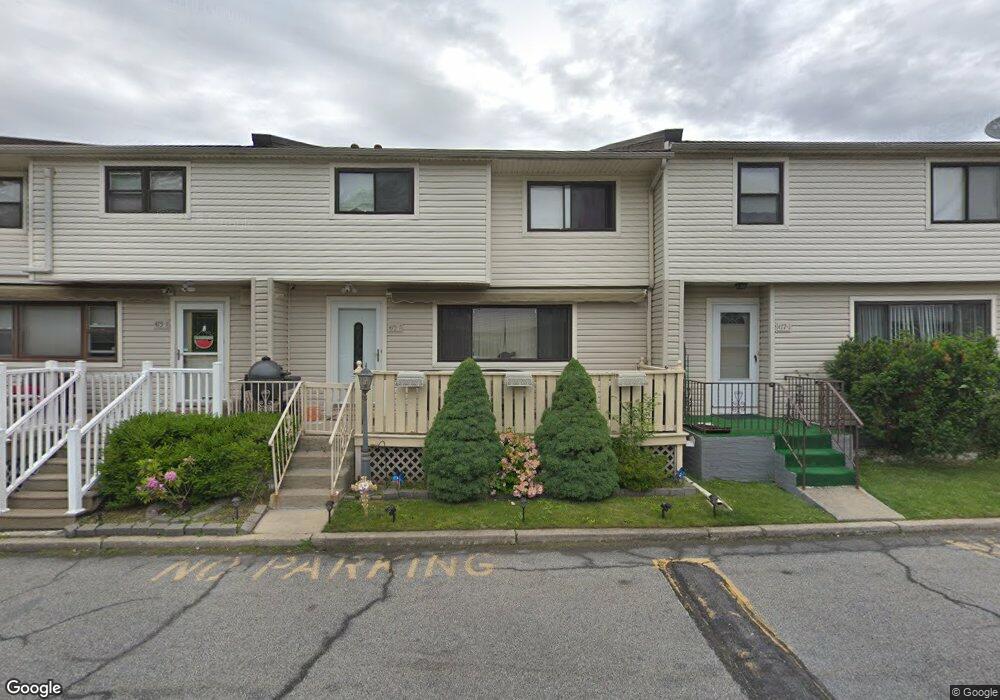
475 Willow Rd E Unit 1 Staten Island, NY 10314
Westerleigh NeighborhoodEstimated Value: $494,914 - $556,000
Studio
--
Bath
1,248
Sq Ft
$414/Sq Ft
Est. Value
About This Home
This home is located at 475 Willow Rd E Unit 1, Staten Island, NY 10314 and is currently estimated at $516,229, approximately $413 per square foot. 475 Willow Rd E Unit 1 is a home located in Richmond County with nearby schools including P.S. 30 Westerleigh, I.S. 51 Edwin Markham, and Port Richmond High School.
Ownership History
Date
Name
Owned For
Owner Type
Purchase Details
Closed on
Oct 9, 2015
Sold by
Asdal Maryanne and Episcopia Joseph
Bought by
Winfield Tarell
Current Estimated Value
Purchase Details
Closed on
Dec 16, 2013
Sold by
Potter Kristin
Bought by
Asdal Mary Anne and Episcopia Joseph
Purchase Details
Closed on
Mar 8, 2004
Sold by
Mctigue Thaddeus J and Mctigue Elizabeth J
Bought by
Potter Kristin
Home Financials for this Owner
Home Financials are based on the most recent Mortgage that was taken out on this home.
Original Mortgage
$70,000
Interest Rate
6.12%
Mortgage Type
New Conventional
Create a Home Valuation Report for This Property
The Home Valuation Report is an in-depth analysis detailing your home's value as well as a comparison with similar homes in the area
Home Values in the Area
Average Home Value in this Area
Purchase History
| Date | Buyer | Sale Price | Title Company |
|---|---|---|---|
| Winfield Tarell | $285,000 | The Security Title Guarantee | |
| Asdal Mary Anne | -- | The Judicial Title Insurance | |
| Potter Kristin | $225,000 | First American Title Insuran |
Source: Public Records
Mortgage History
| Date | Status | Borrower | Loan Amount |
|---|---|---|---|
| Previous Owner | Potter Kristin | $70,000 |
Source: Public Records
Tax History
| Year | Tax Paid | Tax Assessment Tax Assessment Total Assessment is a certain percentage of the fair market value that is determined by local assessors to be the total taxable value of land and additions on the property. | Land | Improvement |
|---|---|---|---|---|
| 2025 | $3,673 | $30,213 | $1,200 | $29,013 |
| 2024 | $3,673 | $24,701 | $1,456 | $23,245 |
| 2023 | $3,504 | $17,252 | $1,475 | $15,777 |
| 2022 | $3,249 | $20,493 | $1,967 | $18,526 |
| 2021 | $3,232 | $18,634 | $1,967 | $16,667 |
| 2020 | $3,251 | $19,532 | $1,967 | $17,565 |
| 2019 | $3,188 | $18,363 | $1,967 | $16,396 |
| 2018 | $2,931 | $14,377 | $1,630 | $12,747 |
| 2017 | $2,765 | $13,564 | $1,669 | $11,895 |
| 2016 | $2,558 | $12,798 | $1,637 | $11,161 |
| 2015 | $2,437 | $12,798 | $1,662 | $11,136 |
| 2014 | $2,437 | $12,700 | $1,544 | $11,156 |
Source: Public Records
Map
Nearby Homes
- 448-2 Caswell Ave
- 226 Cambridge Ave
- 537 Willow Rd E Unit 1
- 234 Cambridge Ave
- 238 Cambridge Ave
- 251 Cambridge Ave
- 74 Sumner Ave
- 11 Thurston St
- 205 Hawthorne Ave
- 22 Francine Ln
- 327 Willow Rd E
- 11 Denton Place
- 124 Woodbine Ave
- 493 Willowbrook Rd
- 581 W Caswell Ave
- 1406 Richmond Ave
- 100 Debbie St Unit B
- 465 Stewart Ave
- 777-805 Willowbrook Rd
- 467 Stewart Ave
- 475 Willow Rd E Unit 2
- 475 Willow Rd E
- 461 Willow Rd E Unit 2
- 461 Willow Rd E Unit 1
- 461 Willow Rd E
- 479 Willow Rd E Unit 2
- 481 Willow Rd E Unit 2
- 481 Willow Rd E Unit 1
- 479 Willow Rd E Unit 1
- 479-1 Willow Rd E
- 483 Willow Rd E Unit 2
- 483 Willow Rd E Unit 1
- 469 Willow Rd E Unit 2
- 467 Willow Rd E Unit 2
- 467 Willow Rd E Unit 1
- 467 Willow Rd E Unit 467-2
- 459 Willow Rd E Unit 2
- 459 Willow Rd E Unit 1
- 459 Willow Rd E
- 485 Willow Rd E Unit 2
Your Personal Tour Guide
Ask me questions while you tour the home.