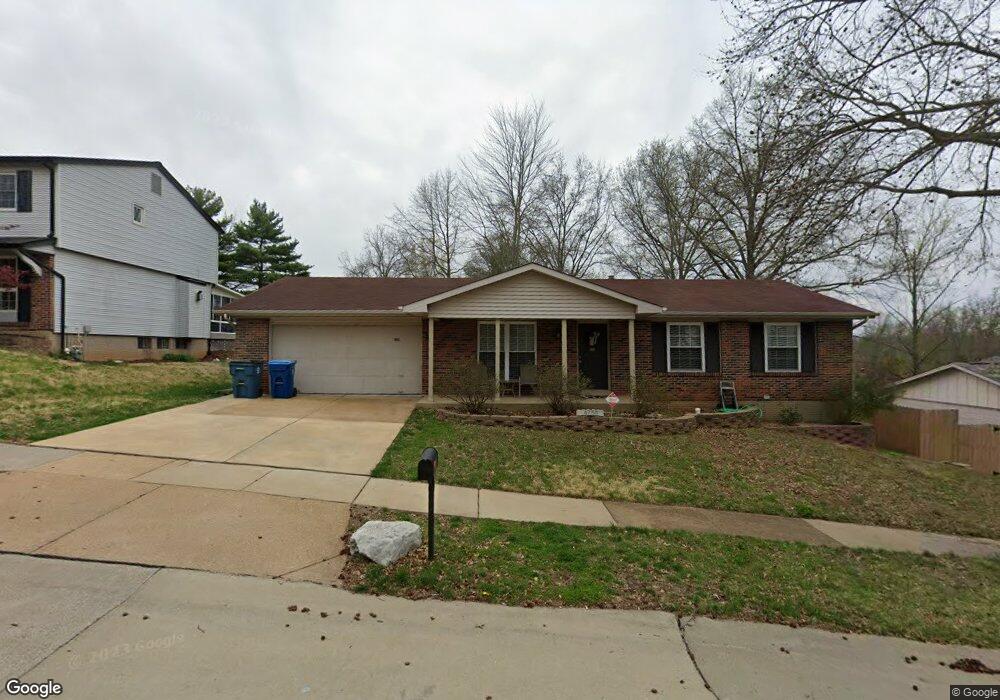
4750 Groveton Way Saint Louis, MO 63128
Estimated Value: $309,000 - $332,000
3
Beds
3
Baths
1,160
Sq Ft
$276/Sq Ft
Est. Value
About This Home
This home is located at 4750 Groveton Way, Saint Louis, MO 63128 and is currently estimated at $320,289, approximately $276 per square foot. 4750 Groveton Way is a home located in St. Louis County with nearby schools including Hagemann Elementary School, Washington Middle School, and Mehlville High School.
Ownership History
Date
Name
Owned For
Owner Type
Purchase Details
Closed on
Jun 30, 2016
Sold by
Paradoski Mary L
Bought by
Paradoski Eric Rpbert and Paradoski Nicole Marie
Current Estimated Value
Home Financials for this Owner
Home Financials are based on the most recent Mortgage that was taken out on this home.
Original Mortgage
$114,000
Outstanding Balance
$90,761
Interest Rate
3.58%
Mortgage Type
New Conventional
Estimated Equity
$229,528
Purchase Details
Closed on
Oct 8, 1998
Sold by
Paradoski Leo M and Paradoski Margaret
Bought by
Paradoski Mary L
Home Financials for this Owner
Home Financials are based on the most recent Mortgage that was taken out on this home.
Original Mortgage
$111,900
Interest Rate
6.73%
Purchase Details
Closed on
Jun 27, 1997
Sold by
Moore Randolph E and May Sandra
Bought by
Paradoski Mary L and Paradoski Leo M
Home Financials for this Owner
Home Financials are based on the most recent Mortgage that was taken out on this home.
Original Mortgage
$110,000
Interest Rate
5.87%
Create a Home Valuation Report for This Property
The Home Valuation Report is an in-depth analysis detailing your home's value as well as a comparison with similar homes in the area
Home Values in the Area
Average Home Value in this Area
Purchase History
| Date | Buyer | Sale Price | Title Company |
|---|---|---|---|
| Paradoski Eric Rpbert | -- | Orntic St Louis | |
| Paradoski Mary L | -- | -- | |
| Paradoski Mary L | -- | -- |
Source: Public Records
Mortgage History
| Date | Status | Borrower | Loan Amount |
|---|---|---|---|
| Open | Paradoski Eric Rpbert | $114,000 | |
| Closed | Paradoski Mary L | $111,900 | |
| Closed | Paradoski Mary L | $110,000 |
Source: Public Records
Tax History Compared to Growth
Tax History
| Year | Tax Paid | Tax Assessment Tax Assessment Total Assessment is a certain percentage of the fair market value that is determined by local assessors to be the total taxable value of land and additions on the property. | Land | Improvement |
|---|---|---|---|---|
| 2025 | $3,192 | $55,080 | $15,620 | $39,460 |
| 2024 | $3,192 | $47,450 | $15,620 | $31,830 |
| 2023 | $3,151 | $47,450 | $15,620 | $31,830 |
| 2022 | $2,427 | $36,640 | $13,020 | $23,620 |
| 2021 | $2,348 | $36,640 | $13,020 | $23,620 |
| 2020 | $2,329 | $34,550 | $11,290 | $23,260 |
| 2019 | $2,322 | $34,550 | $11,290 | $23,260 |
| 2018 | $2,513 | $33,800 | $8,680 | $25,120 |
| 2017 | $2,511 | $33,820 | $8,680 | $25,140 |
| 2016 | $2,595 | $33,550 | $8,680 | $24,870 |
| 2015 | $2,383 | $33,550 | $8,680 | $24,870 |
| 2014 | $2,312 | $32,220 | $7,390 | $24,830 |
Source: Public Records
Map
Nearby Homes
- 4716 Medalton Way
- 5626 Greenton Way
- 5414 Village Courtway Ln
- 4968 Quail Crest Ct
- 4523 Beaver Brook Ct
- 13266 East Ln
- 5401 Green Cedar Way Unit 6
- 13232 East Ln
- 5812 Chrisbrook Dr
- 5028 Baldcypress Ct
- 5714 Shining Day Place
- 4540 Butler Hill Rd
- 5952 Shortleaf Ct
- 5317 Hamlin Ct
- 5417 Morningdale Place
- 5263 Faro Dr
- 5161 Butler Bend Dr
- 13372 Bahnfyre Dr
- 5251 Tuscan Chase Ct
- 5134 Butler Hill Ct
- 4744 Groveton Way
- 4756 Groveton Way
- 4772 Groveton Way
- 4738 Groveton Way
- 4751 Groveton Way
- 4745 Groveton Way
- 4755 Groveton Way
- 4739 Groveton Way
- 4778 Groveton Way
- 4732 Groveton Way
- 4741 Brookton Way
- 4761 Groveton Way
- 4747 Brookton Way
- 4765 Groveton Way
- 4733 Groveton Way
- 4769 Groveton Way
- 4735 Brookton Way
- 4753 Brookton Way
- 4775 Groveton Way
- 4728 Groveton Way