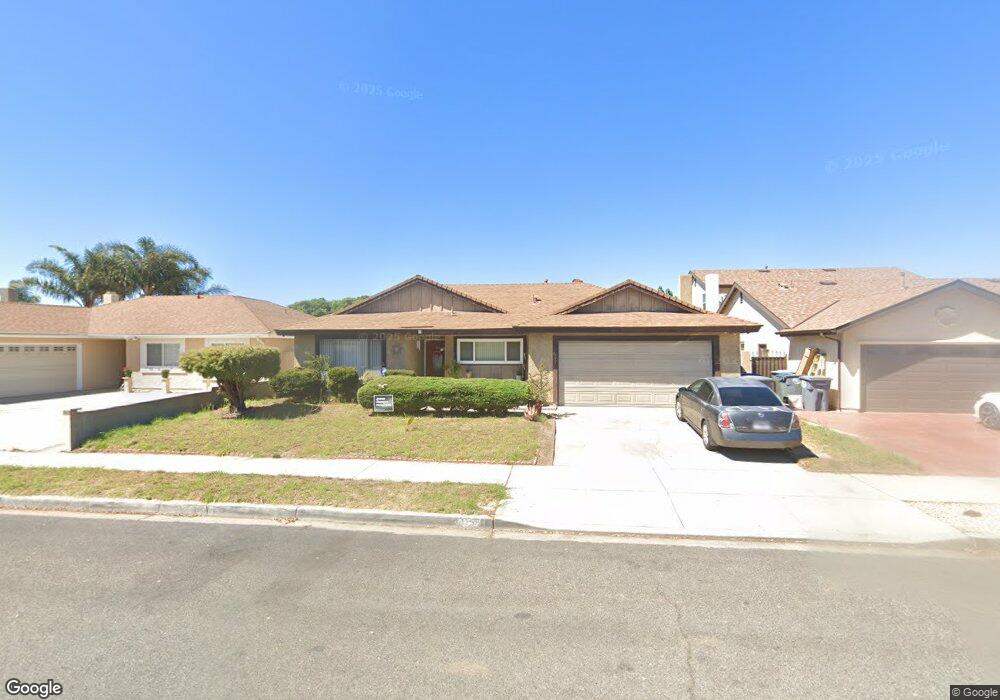
4751 Halsey Way Oxnard, CA 93033
Pleasant Valley Estates NeighborhoodEstimated Value: $714,664 - $758,000
5
Beds
2
Baths
1,800
Sq Ft
$410/Sq Ft
Est. Value
About This Home
This home is located at 4751 Halsey Way, Oxnard, CA 93033 and is currently estimated at $737,916, approximately $409 per square foot. 4751 Halsey Way is a home located in Ventura County with nearby schools including Julien Hathaway Elementary School and Channel Islands High School.
Ownership History
Date
Name
Owned For
Owner Type
Purchase Details
Closed on
Aug 20, 2022
Sold by
Lacbain Lolita M and Lacbain Eduardo M
Bought by
Lacbain Family Trust
Current Estimated Value
Purchase Details
Closed on
Jun 2, 1997
Sold by
Mcgullam Stephan J and Mcgullam Kathleen M
Bought by
Lacbain Eduardo M and Lacbain Lolita
Home Financials for this Owner
Home Financials are based on the most recent Mortgage that was taken out on this home.
Original Mortgage
$160,481
Interest Rate
7.83%
Mortgage Type
FHA
Purchase Details
Closed on
Feb 28, 1994
Sold by
Mcgullam Stephen J and Mcgullam Kathleen M
Bought by
Mcgullam Stephen J and Mcgullam Kathleen M
Home Financials for this Owner
Home Financials are based on the most recent Mortgage that was taken out on this home.
Original Mortgage
$110,000
Interest Rate
7%
Create a Home Valuation Report for This Property
The Home Valuation Report is an in-depth analysis detailing your home's value as well as a comparison with similar homes in the area
Home Values in the Area
Average Home Value in this Area
Purchase History
| Date | Buyer | Sale Price | Title Company |
|---|---|---|---|
| Lacbain Family Trust | -- | None Listed On Document | |
| Lacbain Eduardo M | $164,000 | Fidelity National Title Co | |
| Mcgullam Stephen J | -- | Commonwealth Land Title Co |
Source: Public Records
Mortgage History
| Date | Status | Borrower | Loan Amount |
|---|---|---|---|
| Previous Owner | Lacbain Eduardo M | $160,481 | |
| Previous Owner | Mcgullam Stephen J | $110,000 |
Source: Public Records
Tax History Compared to Growth
Tax History
| Year | Tax Paid | Tax Assessment Tax Assessment Total Assessment is a certain percentage of the fair market value that is determined by local assessors to be the total taxable value of land and additions on the property. | Land | Improvement |
|---|---|---|---|---|
| 2025 | $3,067 | $261,809 | $104,719 | $157,090 |
| 2024 | $3,067 | $256,676 | $102,666 | $154,010 |
| 2023 | $2,886 | $251,644 | $100,653 | $150,991 |
| 2022 | $2,825 | $246,710 | $98,679 | $148,031 |
| 2021 | $2,942 | $241,873 | $96,744 | $145,129 |
| 2020 | $2,996 | $239,395 | $95,753 | $143,642 |
| 2019 | $2,907 | $234,702 | $93,876 | $140,826 |
| 2018 | $2,800 | $230,101 | $92,036 | $138,065 |
| 2017 | $2,710 | $225,590 | $90,232 | $135,358 |
| 2016 | $2,582 | $221,167 | $88,463 | $132,704 |
| 2015 | $2,621 | $217,846 | $87,135 | $130,711 |
| 2014 | $2,574 | $213,580 | $85,429 | $128,151 |
Source: Public Records
Map
Nearby Homes
- 5222 Longfellow Way
- 4160 Petit Dr Unit 39
- 5170 Edgar St
- 234 Johnson Rd
- 5225 Columbus Place
- 445 Gaviota Place Unit 124
- 1630 Nelson Place
- 840 Morro Way
- 5302 Barrymore Dr
- 360 Ibsen Place Unit 129
- 300 Ibsen Place Unit 132
- 4029 S B St
- 172 W Yucca St
- 1960 Peoria Place
- 3630 Dallas Dr
- 145 Homer St
- 341 Cuesta Del Mar Dr
- 0 Saviers Rd
- 4811 S G St
- 4010 S J St
- 4741 Halsey Way
- 4801 Halsey Way
- 824 E Dollie St
- 820 E Dollie St
- 830 E Dollie St
- 4811 Halsey Way
- 814 E Dollie St
- 4750 Halsey Way
- 4740 Halsey Way
- 4821 Halsey Way
- 810 E Dollie St
- 4810 Halsey Way
- 4720 Justin Way
- 4710 Justin Way
- 4730 Justin Way
- 4700 Justin Way
- 4740 Justin Way
- 4801 Justin Way
- 4825 Halsey Way
- 4824 Halsey Way