
Seller's Agent in 2025
John Bissman
Keller Williams Advisors
(513) 800-0675
8 in this area
324 Total Sales
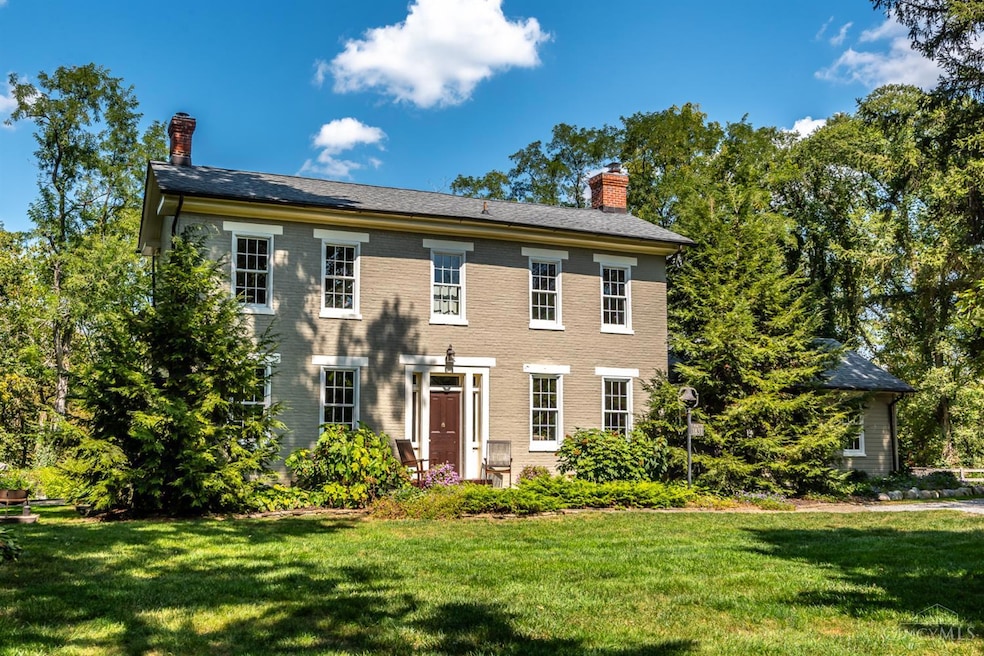
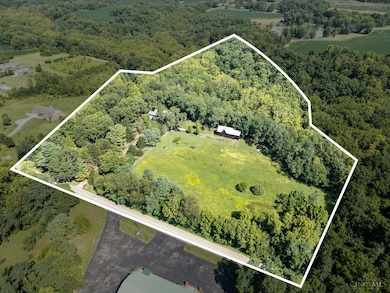
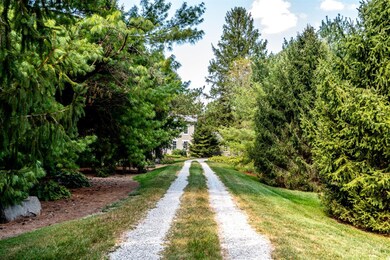
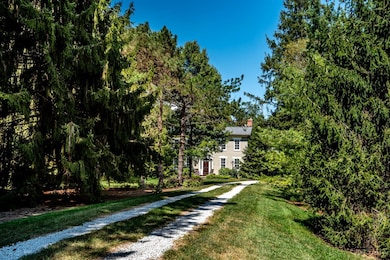
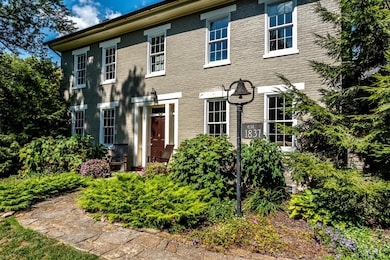
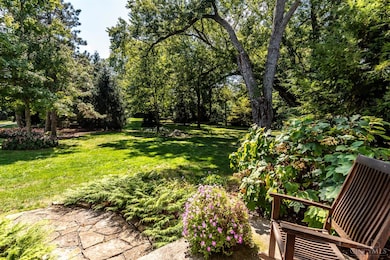
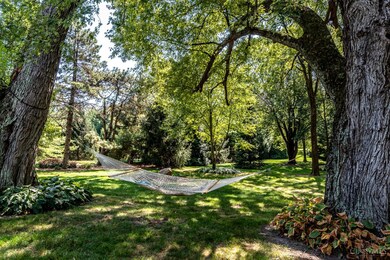
Discover timeless beauty in this traditional Quaker-style farmhouse, built in 1837 & thoughtfully expanded for today's living. 9.87 acres of rolling countryside provide the perfect balance of peace, privacy & convenience. Enjoy the best of country living with fenced pasture, 1901 barn with electric, and 16x32 fiberglass pool. Inside, character meets comfort with gorgeous wood floors, wood Anderson windows, 3 working fireplaces and custom kitchen featuring handcrafted cabinetry, granite c-tops and modern appliances. Flexible living spaces include the option for a first-floor primary suite or in-law suite and attached 2-car garage with 220amp outlet with EV charging. Historic details are preserved throughout, enhanced by upgrades like a partial basement, security system and smart dual heating & cooling systems. Just minutes from Caesar Creek Lake, downtown Waynesville shops and dining, and easy highway access. This property is a rare find that offers it all!
Last Agent to Sell the Property
Keller Williams Advisors License #2013001391 Listed on: 09/17/2025
| Date | Type | Sale Price | Title Company |
|---|---|---|---|
| Warranty Deed | $865,000 | Home Services Title | |
| Warranty Deed | $385,000 | -- | |
| Deed | $261,000 | -- | |
| Deed | $230,000 | -- | |
| Deed | $140,000 | -- |
| Date | Status | Loan Amount | Loan Type |
|---|---|---|---|
| Open | $347,950 | New Conventional | |
| Previous Owner | $339,000 | New Conventional |
| Date | Event | Price | List to Sale | Price per Sq Ft |
|---|---|---|---|---|
| 11/25/2025 11/25/25 | Sold | $865,000 | -3.9% | $259 / Sq Ft |
| 10/24/2025 10/24/25 | Pending | -- | -- | -- |
| 10/08/2025 10/08/25 | Price Changed | $899,900 | -1.7% | $270 / Sq Ft |
| 09/17/2025 09/17/25 | For Sale | $915,000 | -- | $274 / Sq Ft |
| Year | Tax Paid | Tax Assessment Tax Assessment Total Assessment is a certain percentage of the fair market value that is determined by local assessors to be the total taxable value of land and additions on the property. | Land | Improvement |
|---|---|---|---|---|
| 2025 | $7,922 | $196,960 | $84,570 | $112,390 |
| 2024 | $7,922 | $196,960 | $84,570 | $112,390 |
| 2023 | $7,087 | $154,763 | $54,918 | $99,844 |
| 2022 | $6,928 | $154,763 | $54,919 | $99,845 |
| 2021 | $6,645 | $154,763 | $54,919 | $99,845 |
| 2020 | $6,264 | $125,825 | $44,650 | $81,176 |
| 2019 | $6,267 | $125,825 | $44,650 | $81,176 |
| 2018 | $6,269 | $125,825 | $44,650 | $81,176 |
| 2017 | $5,905 | $110,611 | $37,660 | $72,951 |
| 2016 | $5,513 | $110,611 | $37,660 | $72,951 |
| 2015 | $5,522 | $110,611 | $37,660 | $72,951 |
| 2014 | $5,358 | $101,750 | $36,620 | $65,140 |
| 2013 | $5,348 | $117,250 | $38,440 | $78,810 |
Seller's Agent in 2025
John Bissman
Keller Williams Advisors
(513) 800-0675
8 in this area
324 Total Sales
Seller Co-Listing Agent in 2025
Tiffany Bruning
Keller Williams Advisors
(513) 545-3020
1 in this area
43 Total Sales
Source: MLS of Greater Cincinnati (CincyMLS)
MLS Number: 1855344
APN: 09-12-400-002
Disclaimer: Certain information contained herein is derived from information provided by parties other than Homes.com. All information provided is deemed reliable, but is not guaranteed to be accurate and should be independently verified.
![]() The data relating to real estate for sale on this website comes in part from the Broker Reciprocity programs of the MLS of Greater Cincinnati, Inc.. Those listings held by brokerage firms other than Ten-X are marked with the Broker Reciprocity logo and house icon. The properties displayed may not be all of the properties available through Broker Reciprocity.
The data relating to real estate for sale on this website comes in part from the Broker Reciprocity programs of the MLS of Greater Cincinnati, Inc.. Those listings held by brokerage firms other than Ten-X are marked with the Broker Reciprocity logo and house icon. The properties displayed may not be all of the properties available through Broker Reciprocity.
IDX information is provided exclusively for personal, non-commercial use, and may not be used for any purpose other than to identify prospective properties consumers may be interested in purchasing.
Information is deemed reliable but not guaranteed.
Ten-X does not display the entire Cincinnati MLS Broker Reciprocity™ database on this web site. The listings of some real estate brokerage firms have been excluded.
Copyright 2026, MLS of Greater Cincinnati, Inc. All rights reserved
Ask me questions while you tour the home.