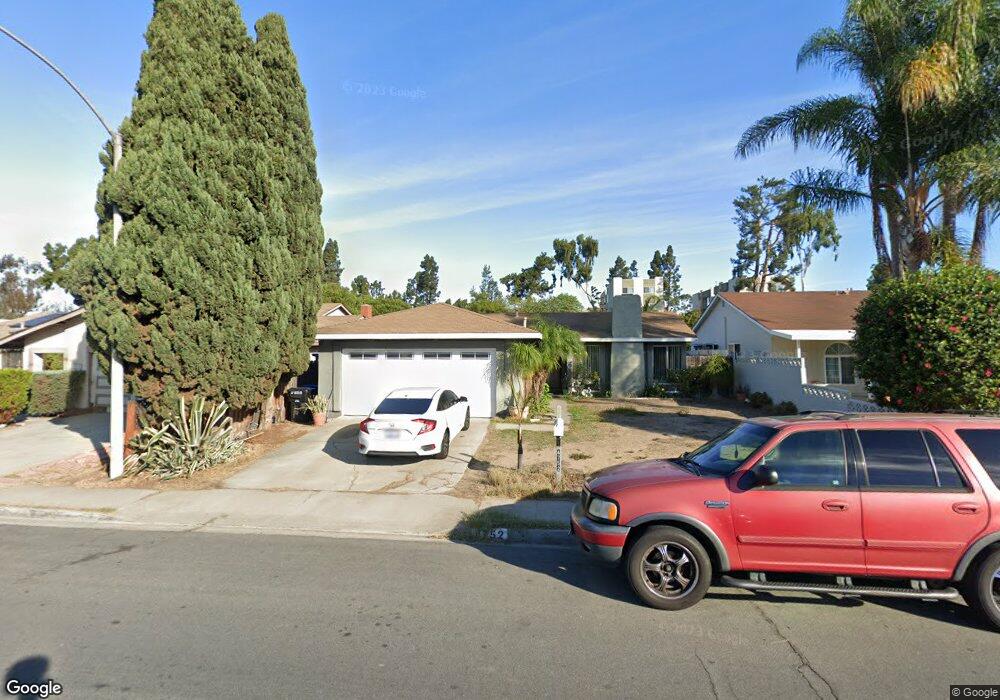
4752 Magnus Way San Diego, CA 92113
Lincoln Park NeighborhoodEstimated Value: $757,145 - $793,000
4
Beds
2
Baths
1,365
Sq Ft
$569/Sq Ft
Est. Value
About This Home
This home is located at 4752 Magnus Way, San Diego, CA 92113 and is currently estimated at $776,036, approximately $568 per square foot. 4752 Magnus Way is a home located in San Diego County with nearby schools including Porter Elementary School, Knox Middle, and Lincoln High School.
Ownership History
Date
Name
Owned For
Owner Type
Purchase Details
Closed on
Oct 26, 2010
Sold by
Parker Greg A
Bought by
Torres Luis and Torres Aida A
Current Estimated Value
Home Financials for this Owner
Home Financials are based on the most recent Mortgage that was taken out on this home.
Original Mortgage
$217,000
Interest Rate
4.35%
Mortgage Type
New Conventional
Purchase Details
Closed on
May 14, 2010
Sold by
Waller Reginald J
Bought by
Parker Greg A
Purchase Details
Closed on
Jun 1, 2006
Sold by
Waller Joyce H
Bought by
Waller Reginald J
Home Financials for this Owner
Home Financials are based on the most recent Mortgage that was taken out on this home.
Original Mortgage
$360,000
Interest Rate
1.75%
Mortgage Type
Negative Amortization
Purchase Details
Closed on
Apr 3, 1999
Sold by
Waller Donna
Bought by
Waller Reginald
Create a Home Valuation Report for This Property
The Home Valuation Report is an in-depth analysis detailing your home's value as well as a comparison with similar homes in the area
Home Values in the Area
Average Home Value in this Area
Purchase History
| Date | Buyer | Sale Price | Title Company |
|---|---|---|---|
| Torres Luis | $255,000 | California Title Company | |
| Parker Greg A | -- | California Title Company | |
| Parker Greg A | $180,900 | None Available | |
| Waller Reginald J | -- | Stewart Title Of Ca Inc | |
| Waller Reginald | -- | Stewart Title Of California |
Source: Public Records
Mortgage History
| Date | Status | Borrower | Loan Amount |
|---|---|---|---|
| Previous Owner | Torres Luis | $217,000 | |
| Previous Owner | Waller Reginald J | $360,000 |
Source: Public Records
Tax History Compared to Growth
Tax History
| Year | Tax Paid | Tax Assessment Tax Assessment Total Assessment is a certain percentage of the fair market value that is determined by local assessors to be the total taxable value of land and additions on the property. | Land | Improvement |
|---|---|---|---|---|
| 2025 | $3,882 | $326,686 | $192,170 | $134,516 |
| 2024 | $3,882 | $320,281 | $188,402 | $131,879 |
| 2023 | $3,795 | $314,002 | $184,708 | $129,294 |
| 2022 | $3,692 | $307,846 | $181,087 | $126,759 |
| 2021 | $3,665 | $301,811 | $177,537 | $124,274 |
| 2020 | $3,620 | $298,717 | $175,717 | $123,000 |
| 2019 | $3,555 | $292,861 | $172,272 | $120,589 |
| 2018 | $3,323 | $287,120 | $168,895 | $118,225 |
| 2017 | $80 | $281,491 | $165,584 | $115,907 |
| 2016 | $3,188 | $275,973 | $162,338 | $113,635 |
| 2015 | $3,140 | $271,829 | $159,900 | $111,929 |
| 2014 | $3,090 | $266,505 | $156,768 | $109,737 |
Source: Public Records
Map
Nearby Homes
- 1370 Wyconda Way
- 5017 Reynolds St
- 5051 Pelusa St
- 635 S 47th St Unit 37
- 745 West St
- 2305 Wisteria Way
- 5033 La Paz Dr
- 812 West St
- 4895 Bunnell St
- 4402 Delta St Unit 23
- 4300 Newton Ave Unit 31
- 4300 Newton Ave Unit 106
- 4300 Newton Ave Unit 45
- 4300 Newton Ave Unit 29
- 325 Gloria St
- 999 E Division St Unit E24
- 1341 E 4th St
- 420 S 45th St
- 237 S Willie James Jones Ave
- 621 R Ave Unit 22
- 4742 Magnus Way
- 4762 Magnus Way
- 4734 Magnus Way
- 4772 Magnus Way
- 4726 Magnus Way
- 4782 Magnus Way
- 4751 Magnus Way
- 4761 Magnus Way
- 4741 Magnus Way
- 1356 Privado Place
- 4771 Magnus Way
- 4722 Magnus Way
- 4733 Magnus Way
- 1366 Privado Place
- 1346 Privado Place
- 4781 Magnus Way
- 4777 Solola Ave
- 4725 Magnus Way
- 4785 Magnus Way
- 4785 Solola Ave