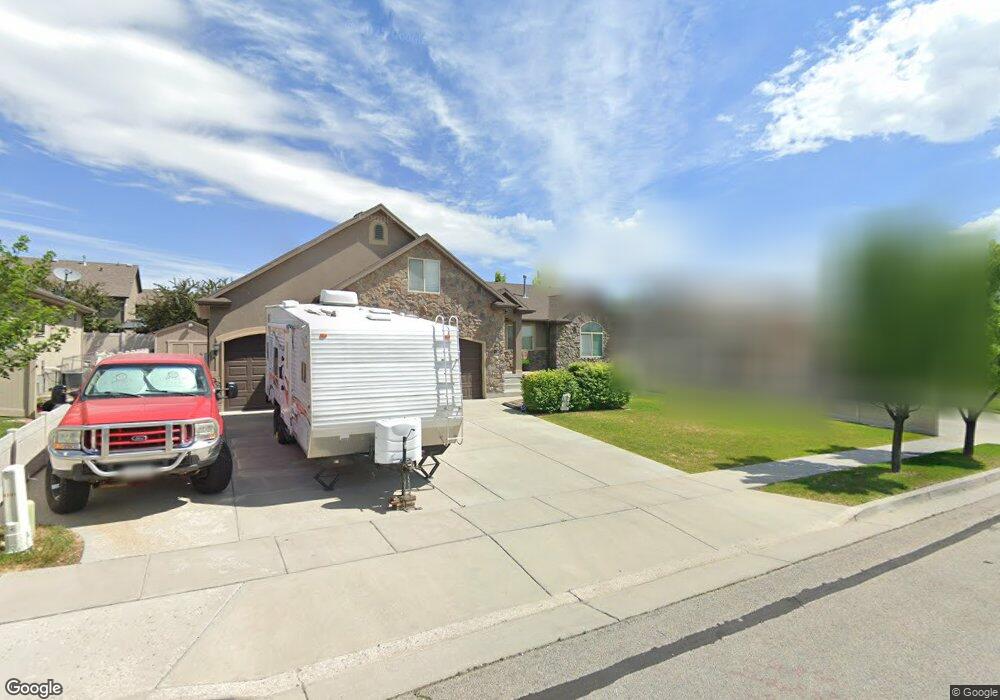
4752 W 7510 S Unit 360 West Jordan, UT 84084
Shadow Mountain NeighborhoodEstimated Value: $594,000 - $715,000
3
Beds
3
Baths
1,573
Sq Ft
$420/Sq Ft
Est. Value
About This Home
This home is located at 4752 W 7510 S Unit 360, West Jordan, UT 84084 and is currently estimated at $660,846, approximately $420 per square foot. 4752 W 7510 S Unit 360 is a home located in Salt Lake County with nearby schools including Hayden Peak Elementary School, West Hills Middle School, and Copper Hills High School.
Ownership History
Date
Name
Owned For
Owner Type
Purchase Details
Closed on
Jul 13, 2011
Sold by
Oldroyd Lyle Tod and Linn Oldroyd K
Bought by
Oldroyd Lyle Tod and Linn Oldroyd K
Current Estimated Value
Home Financials for this Owner
Home Financials are based on the most recent Mortgage that was taken out on this home.
Original Mortgage
$242,437
Outstanding Balance
$166,711
Interest Rate
4.5%
Mortgage Type
New Conventional
Estimated Equity
$494,135
Purchase Details
Closed on
Apr 13, 2011
Sold by
Bangerter Homes Llc
Bought by
Design Builders Lc
Home Financials for this Owner
Home Financials are based on the most recent Mortgage that was taken out on this home.
Original Mortgage
$220,000
Interest Rate
4.83%
Mortgage Type
Purchase Money Mortgage
Purchase Details
Closed on
Jul 19, 2010
Sold by
Richmond American Homes Of Utah Inc
Bought by
Bangerter Homes Llc
Create a Home Valuation Report for This Property
The Home Valuation Report is an in-depth analysis detailing your home's value as well as a comparison with similar homes in the area
Home Values in the Area
Average Home Value in this Area
Purchase History
| Date | Buyer | Sale Price | Title Company |
|---|---|---|---|
| Oldroyd Lyle Tod | -- | Accommodation | |
| Oldroyd Lyle Tod | -- | Metro National Title | |
| Design Builders Lc | -- | Metro National Title | |
| Bangerter Homes Llc | -- | First American Title |
Source: Public Records
Mortgage History
| Date | Status | Borrower | Loan Amount |
|---|---|---|---|
| Open | Oldroyd Lyle Tod | $242,437 | |
| Previous Owner | Design Builders Lc | $220,000 |
Source: Public Records
Tax History Compared to Growth
Tax History
| Year | Tax Paid | Tax Assessment Tax Assessment Total Assessment is a certain percentage of the fair market value that is determined by local assessors to be the total taxable value of land and additions on the property. | Land | Improvement |
|---|---|---|---|---|
| 2025 | $3,323 | $665,300 | $162,400 | $502,900 |
| 2024 | $3,323 | $639,300 | $155,600 | $483,700 |
| 2023 | $3,337 | $605,100 | $146,700 | $458,400 |
| 2022 | $3,381 | $603,200 | $143,900 | $459,300 |
| 2021 | $2,879 | $467,600 | $110,300 | $357,300 |
| 2020 | $2,686 | $409,300 | $110,300 | $299,000 |
| 2019 | $2,692 | $402,300 | $86,300 | $316,000 |
| 2018 | $2,567 | $380,500 | $83,300 | $297,200 |
| 2017 | $2,357 | $347,900 | $83,300 | $264,600 |
| 2016 | $2,361 | $327,300 | $83,300 | $244,000 |
| 2015 | $2,180 | $294,700 | $82,600 | $212,100 |
| 2014 | $2,149 | $286,000 | $81,000 | $205,000 |
Source: Public Records
Map
Nearby Homes
- 7502 S Lace Wood Dr Unit 417
- 7493 S Lace Wood Dr
- 7173 S Kristilyn Ln
- 6880 S Survey Peak Ln
- 6884 S Survey Peak Ln
- 6888 S Survey Peak Ln
- 7563 S Opal Mountain Way W Unit 306
- 7567 S Opal Mountain Way W Unit 307
- 7556 S Opal Mountain Way W Unit 311
- 7569 S Opal Mountain Way W Unit 308
- 7554 S Opal Mountain Way W Unit 310
- 7553 S Opal Mountain Way W Unit 302
- 7138 S Brittany Town Dr
- 7093 S Greensand Dr
- 7414 Regal Hill Dr
- 7071 S Kristilyn Ln
- 4678 Emmons Dr
- 7973 S Nebo Dr
- 7288 Comet Hill Cir
- 6983 Florentine Way
- 4748 W 7510 S
- 4748 W 7510 S Unit 361
- 4768 W 7510 S
- 4757 W 7470 S Unit 363
- 4769 W 7470 S Unit 364
- 4769 W 7470 S
- 4743 W 7470 S Unit 362
- 4743 W 7470 S
- 7519 S 4770 W
- 7519 S 4770 W Unit 341
- 7522 S 4730 W Unit 340
- 4773 W 7470 S Unit 365
- 4773 W 7470 S
- 4776 W 7510 S Unit 358
- 4776 W 7510 S
- 7518 S 4770 W
- 7503 S 4730 W
- 7503 S 4730 W Unit 309
- 7531 S 4770 W Unit 342
- 7531 S 4770 W