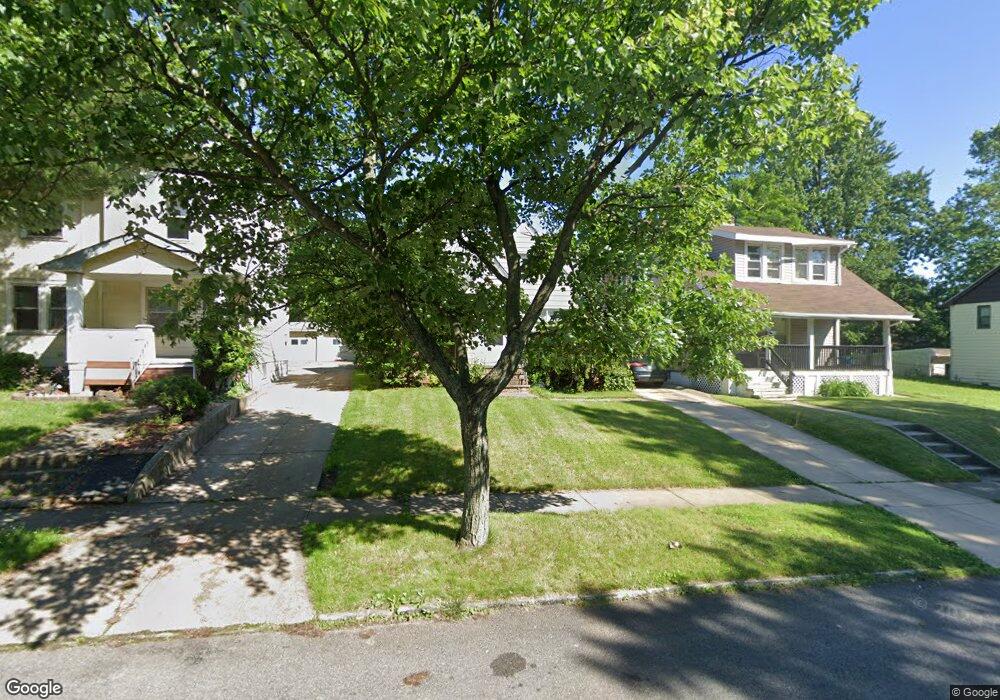
4755 Horton Rd Cleveland, OH 44125
Estimated Value: $98,846 - $116,000
3
Beds
1
Bath
1,150
Sq Ft
$93/Sq Ft
Est. Value
About This Home
This home is located at 4755 Horton Rd, Cleveland, OH 44125 and is currently estimated at $107,212, approximately $93 per square foot. 4755 Horton Rd is a home located in Cuyahoga County with nearby schools including Garfield Heights High School, North Shore High School, and Holy Name Elementary School.
Ownership History
Date
Name
Owned For
Owner Type
Purchase Details
Closed on
Aug 30, 2010
Sold by
Federal Home Loan Mortgage Corporation
Bought by
Talm Properties Llc
Current Estimated Value
Purchase Details
Closed on
Dec 31, 2009
Sold by
Beck Chris M
Bought by
Federal Home Loan Mortgage Corp
Purchase Details
Closed on
Jun 18, 1997
Sold by
Tesny Joel
Bought by
Beck Chris M and Beck Samantha
Home Financials for this Owner
Home Financials are based on the most recent Mortgage that was taken out on this home.
Original Mortgage
$75,920
Interest Rate
8.01%
Mortgage Type
FHA
Purchase Details
Closed on
Aug 1, 1985
Sold by
Good Gerald P
Bought by
Tesny Joel and Tesny Karen P
Purchase Details
Closed on
Jan 4, 1985
Sold by
Good Florence B
Bought by
Good Gerald P
Purchase Details
Closed on
Apr 23, 1984
Sold by
Good Walter J and Good Florence B
Bought by
Good Florence B
Purchase Details
Closed on
Jan 1, 1975
Bought by
Good Walter J and Good Florence B
Create a Home Valuation Report for This Property
The Home Valuation Report is an in-depth analysis detailing your home's value as well as a comparison with similar homes in the area
Home Values in the Area
Average Home Value in this Area
Purchase History
| Date | Buyer | Sale Price | Title Company |
|---|---|---|---|
| Talm Properties Llc | $26,500 | First American Title Ins Co | |
| Federal Home Loan Mortgage Corp | $20,000 | None Available | |
| Beck Chris M | $76,000 | -- | |
| Tesny Joel | $43,500 | -- | |
| Good Gerald P | -- | -- | |
| Good Florence B | -- | -- | |
| Good Walter J | -- | -- |
Source: Public Records
Mortgage History
| Date | Status | Borrower | Loan Amount |
|---|---|---|---|
| Previous Owner | Beck Chris M | $75,920 |
Source: Public Records
Tax History Compared to Growth
Tax History
| Year | Tax Paid | Tax Assessment Tax Assessment Total Assessment is a certain percentage of the fair market value that is determined by local assessors to be the total taxable value of land and additions on the property. | Land | Improvement |
|---|---|---|---|---|
| 2024 | $3,961 | $35,665 | $7,700 | $27,965 |
| 2023 | $2,718 | $23,560 | $5,250 | $18,310 |
| 2022 | $2,679 | $23,560 | $5,250 | $18,310 |
| 2021 | $2,830 | $23,560 | $5,250 | $18,310 |
| 2020 | $2,434 | $18,830 | $4,200 | $14,630 |
| 2019 | $2,414 | $53,800 | $12,000 | $41,800 |
| 2018 | $2,400 | $18,830 | $4,200 | $14,630 |
| 2017 | $2,404 | $17,580 | $3,330 | $14,250 |
| 2016 | $2,439 | $17,580 | $3,330 | $14,250 |
| 2015 | $2,680 | $17,580 | $3,330 | $14,250 |
| 2014 | $2,680 | $21,420 | $4,060 | $17,360 |
Source: Public Records
Map
Nearby Homes
- 4740 Burleigh Rd
- 4699 Burleigh Rd
- 8304 Garfield Blvd
- 4633 Warner Rd
- 4840 E 84th St
- 0 Grand Division Ave
- 4695 E 85th St
- 4821 E 85th St
- 8027 Grand Division Ave
- 4815 E 86th St
- 4646 E 86th St
- 4888 E 85th St
- 4684 E 88th St
- 8115 Bancroft Ave
- 8209 Bancroft Ave
- 4762 E 90th St
- 4909 E 85th St
- 4665 E 88th St
- 4769 E 90th St
- 4729 E 90th St
- 4761 Horton Rd
- 4751 Horton Rd
- 4765 Horton Rd
- 4749 Horton Rd
- 4769 Horton Rd
- 4747 Horton Rd
- 4774 Burleigh Rd
- 4780 Burleigh Rd
- 4780 Burleigh Rd Unit 2/UP
- 4780 Burleigh Rd Unit 1/DN
- 4770 Burleigh Rd
- 4768 Burleigh Rd
- 4784 Burleigh Rd
- 4758 Horton Rd
- 4752 Horton Rd
- 4764 Burleigh Rd
- 4773 Horton Rd
- 4761 Blythin Rd
- 4828 Rockwood Rd
- 4822 Rockwood Rd