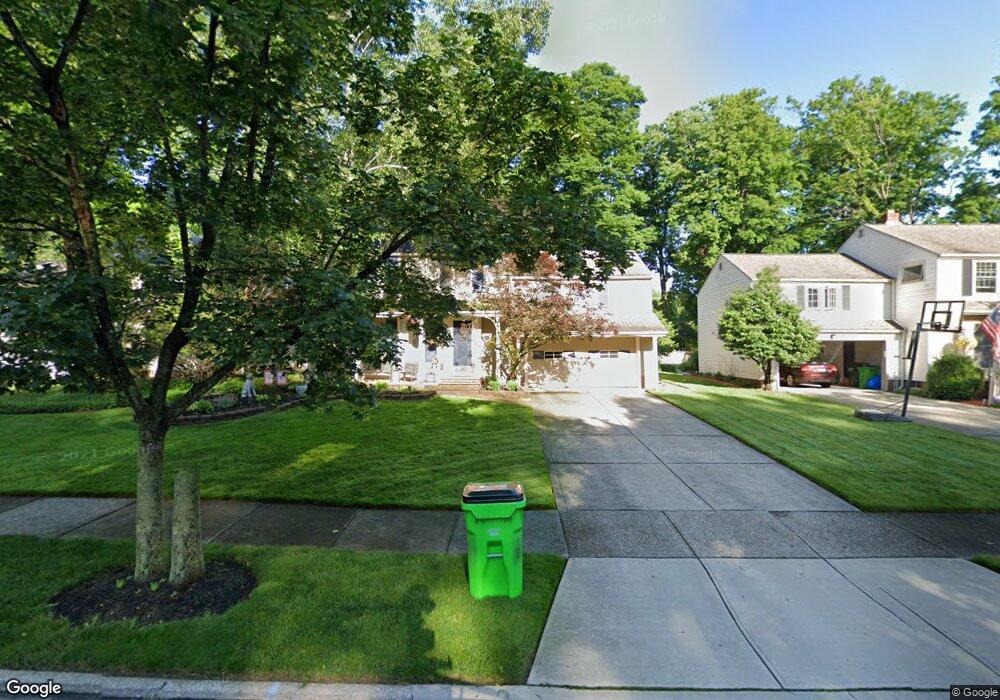
4756 Fay Dr Cleveland, OH 44121
Estimated Value: $273,000 - $282,000
4
Beds
3
Baths
2,208
Sq Ft
$125/Sq Ft
Est. Value
About This Home
This home is located at 4756 Fay Dr, Cleveland, OH 44121 and is currently estimated at $277,065, approximately $125 per square foot. 4756 Fay Dr is a home located in Cuyahoga County with nearby schools including Greenview Upper Elementary School, Sunview Elementary School, and Memorial Junior High School.
Ownership History
Date
Name
Owned For
Owner Type
Purchase Details
Closed on
Feb 11, 2017
Sold by
Seleman John S
Bought by
Seleman John S and Seleman Julie K
Current Estimated Value
Purchase Details
Closed on
Dec 3, 2002
Sold by
Seleman Sharon L
Bought by
Seleman John S
Purchase Details
Closed on
Jan 27, 1997
Sold by
Bisio Gerald
Bought by
Seleman John S and Seleman Sharon L
Home Financials for this Owner
Home Financials are based on the most recent Mortgage that was taken out on this home.
Original Mortgage
$131,700
Outstanding Balance
$15,023
Interest Rate
7.66%
Mortgage Type
New Conventional
Estimated Equity
$262,042
Purchase Details
Closed on
Jan 24, 1984
Sold by
Haase Ferdinand C
Bought by
Bisio Gerald
Purchase Details
Closed on
Aug 31, 1981
Sold by
Blair Philip D
Bought by
Haase Ferdinand C
Purchase Details
Closed on
Aug 18, 1980
Sold by
Hartland William E and M J
Bought by
Blair Philip D
Purchase Details
Closed on
Jan 1, 1975
Bought by
Hartland William E and M J
Create a Home Valuation Report for This Property
The Home Valuation Report is an in-depth analysis detailing your home's value as well as a comparison with similar homes in the area
Home Values in the Area
Average Home Value in this Area
Purchase History
| Date | Buyer | Sale Price | Title Company |
|---|---|---|---|
| Seleman John S | -- | None Available | |
| Seleman John S | -- | Insured Title | |
| Seleman John S | $155,000 | -- | |
| Bisio Gerald | $90,000 | -- | |
| Haase Ferdinand C | $89,000 | -- | |
| Blair Philip D | $87,500 | -- | |
| Hartland William E | -- | -- |
Source: Public Records
Mortgage History
| Date | Status | Borrower | Loan Amount |
|---|---|---|---|
| Open | Seleman John S | $131,700 |
Source: Public Records
Tax History Compared to Growth
Tax History
| Year | Tax Paid | Tax Assessment Tax Assessment Total Assessment is a certain percentage of the fair market value that is determined by local assessors to be the total taxable value of land and additions on the property. | Land | Improvement |
|---|---|---|---|---|
| 2024 | $6,003 | $79,975 | $15,960 | $64,015 |
| 2023 | $5,656 | $60,730 | $13,090 | $47,640 |
| 2022 | $5,625 | $60,725 | $13,090 | $47,635 |
| 2021 | $5,580 | $60,730 | $13,090 | $47,640 |
| 2020 | $5,507 | $52,330 | $11,270 | $41,060 |
| 2019 | $5,018 | $149,500 | $32,200 | $117,300 |
| 2018 | $4,984 | $52,330 | $11,270 | $41,060 |
| 2017 | $5,132 | $49,390 | $9,450 | $39,940 |
| 2016 | $5,099 | $49,390 | $9,450 | $39,940 |
| 2015 | $11,452 | $49,390 | $9,450 | $39,940 |
| 2014 | $11,452 | $49,390 | $9,450 | $39,940 |
Source: Public Records
Map
Nearby Homes
- 4742 Anderson Rd
- 4769 Edenwood Rd
- 981 Hanley Rd
- 4781 Dorshwood Rd
- 4591 Wilburn Dr
- 4860 Anderson Rd
- 4880 Anderson Rd
- 4561 Wilburn Dr
- 4866 Fairlawn Rd
- 4616 Mcfarland Rd
- 4532 Anderson Rd
- 4859 Delevan Dr
- 4669 Liberty Rd
- 4765 Monticello Blvd
- 4832 Monticello Blvd
- 4643 Monticello Blvd
- 4650 Liberty Rd
- 868 Haywood Dr
- 4785 Donald Ave
- 4514 E Berwald Rd