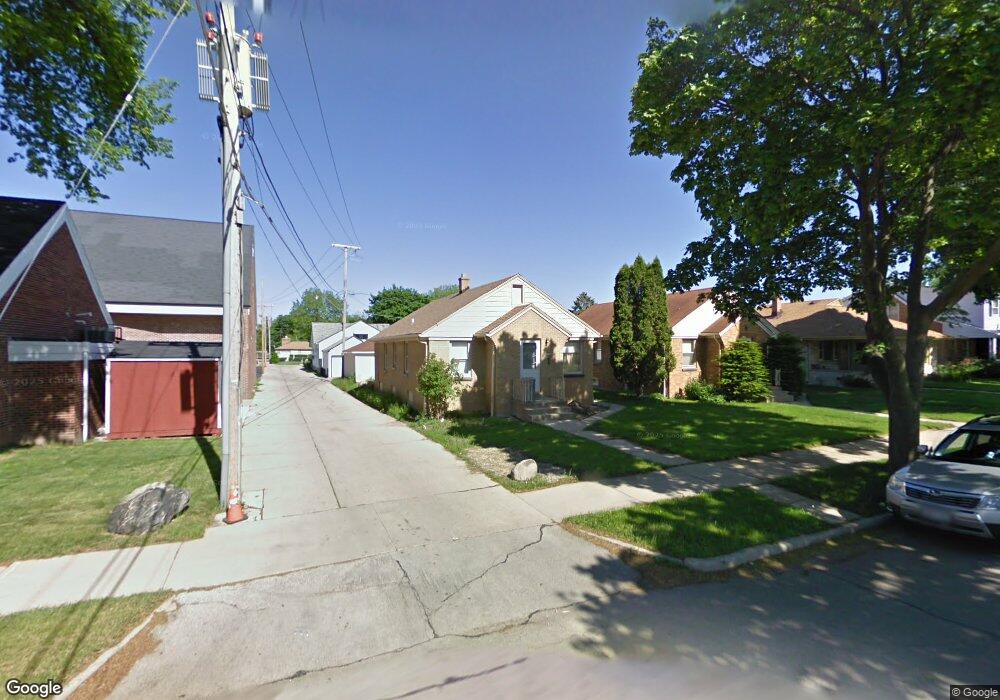
4756 N 19th St Milwaukee, WI 53209
Lincoln Park NeighborhoodEstimated Value: $126,000 - $166,000
2
Beds
1
Bath
1,017
Sq Ft
$141/Sq Ft
Est. Value
About This Home
This home is located at 4756 N 19th St, Milwaukee, WI 53209 and is currently estimated at $143,856, approximately $141 per square foot. 4756 N 19th St is a home located in Milwaukee County with nearby schools including La Escuela Fratney, Craig Montessori School, and Milwaukee German Immersion School.
Ownership History
Date
Name
Owned For
Owner Type
Purchase Details
Closed on
Nov 28, 2023
Sold by
Quantum Real Estate Investments Inc
Bought by
Patton Durand and Brooms Tina
Current Estimated Value
Home Financials for this Owner
Home Financials are based on the most recent Mortgage that was taken out on this home.
Original Mortgage
$126,100
Outstanding Balance
$124,059
Interest Rate
7.63%
Mortgage Type
New Conventional
Estimated Equity
$19,797
Purchase Details
Closed on
Jun 12, 2013
Sold by
Liebe Karri L
Bought by
Quantum Real Estate Investments Inc
Purchase Details
Closed on
Apr 7, 2006
Sold by
Knopp Jennifer
Bought by
Liebe Karri L
Home Financials for this Owner
Home Financials are based on the most recent Mortgage that was taken out on this home.
Original Mortgage
$95,000
Interest Rate
6.42%
Mortgage Type
Fannie Mae Freddie Mac
Purchase Details
Closed on
Jan 27, 2006
Sold by
Tobin Chieko
Bought by
Knopp Jennifer
Create a Home Valuation Report for This Property
The Home Valuation Report is an in-depth analysis detailing your home's value as well as a comparison with similar homes in the area
Home Values in the Area
Average Home Value in this Area
Purchase History
| Date | Buyer | Sale Price | Title Company |
|---|---|---|---|
| Patton Durand | $130,000 | 1St Service Title | |
| Quantum Real Estate Investments Inc | $13,200 | None Available | |
| Liebe Karri L | $100,000 | None Available | |
| Knopp Jennifer | $40,000 | None Available |
Source: Public Records
Mortgage History
| Date | Status | Borrower | Loan Amount |
|---|---|---|---|
| Open | Patton Durand | $126,100 | |
| Previous Owner | Liebe Karri L | $95,000 |
Source: Public Records
Tax History Compared to Growth
Tax History
| Year | Tax Paid | Tax Assessment Tax Assessment Total Assessment is a certain percentage of the fair market value that is determined by local assessors to be the total taxable value of land and additions on the property. | Land | Improvement |
|---|---|---|---|---|
| 2024 | $2,446 | $110,500 | $3,700 | $106,800 |
| 2023 | $1,883 | $79,700 | $3,700 | $76,000 |
| 2022 | $1,824 | $79,700 | $3,700 | $76,000 |
| 2021 | $2,053 | $80,800 | $3,700 | $77,100 |
| 2020 | $2,039 | $80,800 | $3,700 | $77,100 |
| 2019 | $1,235 | $44,800 | $3,700 | $41,100 |
| 2018 | $1,194 | $44,800 | $3,700 | $41,100 |
| 2017 | $1,363 | $44,800 | $4,800 | $40,000 |
| 2016 | $2,120 | $46,700 | $4,800 | $41,900 |
| 2015 | $2,773 | $49,300 | $4,800 | $44,500 |
| 2014 | $2,766 | $49,300 | $4,800 | $44,500 |
| 2013 | -- | $58,000 | $4,800 | $53,200 |
Source: Public Records
Map
Nearby Homes
- 1820 W Hampton Ave
- 4840 N 19th St
- 4738 N 20th St
- 4908 N 19th Place
- 4602 N 20th St
- 4757 N 21st St
- 4959 N 21st St
- 2101 W Fairmount Ave
- 2300 W Cornell St
- 4469 N 20th St
- 4574 N 24th St
- 4906 N 24th Place
- 4828 N 25th St
- 1012 W Eula Ct Unit 14
- 4858 N 26th St
- 4864 N 26th St
- 4318 N 21st St
- 4306 N 21st St
- 4249 N 18th St
- 2619 W Linwal Ln
- 4752 N 19th St
- 4744 N 19th St
- 4740 N 19th St
- 4757 N 18th St
- 4751 N 18th St
- 4747 N 18th St
- 4736 N 19th St
- 1901 W Hampton Ave
- 4757 N 19th St
- 4753 N 19th St
- 4741 N 18th St
- 4751 N 19th St
- 4730 N 19th St
- 4735 N 18th St
- 4739 N 19th St
- 4724 N 19th St
- 4731 N 18th St
- 4731 N 19th St
- 4752 N 18th St
- 4723 N 18th St Unit 4725