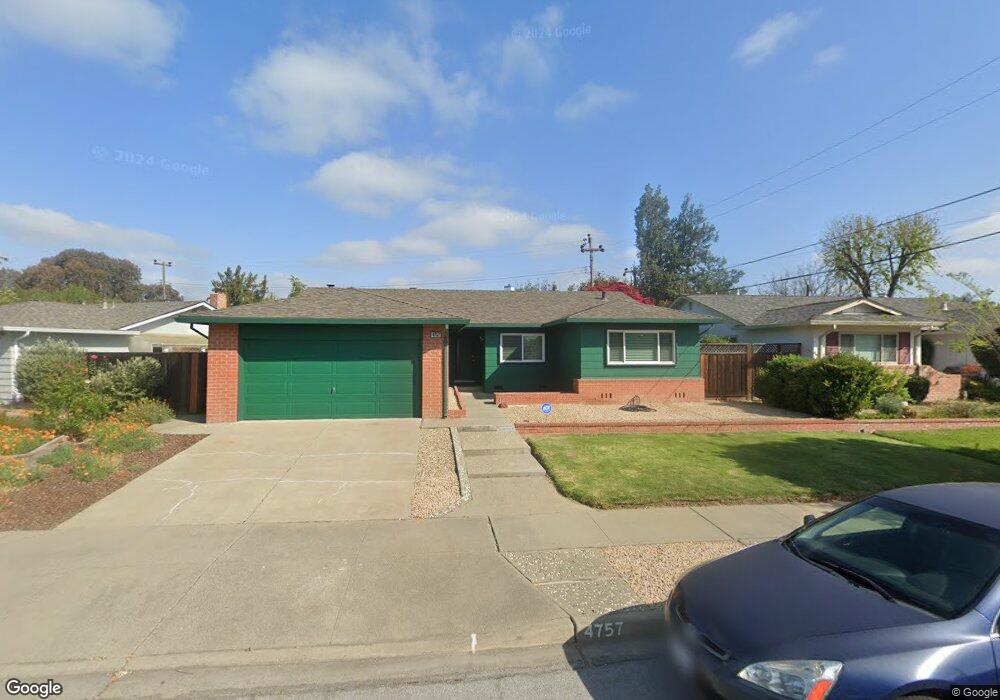
4757 Shelborne Park Ct Fremont, CA 94538
Grimmer NeighborhoodEstimated Value: $1,612,713 - $1,871,000
4
Beds
2
Baths
1,684
Sq Ft
$1,031/Sq Ft
Est. Value
About This Home
This home is located at 4757 Shelborne Park Ct, Fremont, CA 94538 and is currently estimated at $1,736,178, approximately $1,030 per square foot. 4757 Shelborne Park Ct is a home located in Alameda County with nearby schools including Harvey Green Elementary School, John M. Horner Junior High School, and Irvington High School.
Ownership History
Date
Name
Owned For
Owner Type
Purchase Details
Closed on
Sep 18, 2019
Sold by
Patterson Ron and Campbell Revocable Trust
Bought by
Campbell Gregory A
Current Estimated Value
Purchase Details
Closed on
Nov 16, 1994
Sold by
Campbell Carolyn C
Bought by
Campbell Carolyn C and Campbell Revocable Trust
Create a Home Valuation Report for This Property
The Home Valuation Report is an in-depth analysis detailing your home's value as well as a comparison with similar homes in the area
Home Values in the Area
Average Home Value in this Area
Purchase History
| Date | Buyer | Sale Price | Title Company |
|---|---|---|---|
| Campbell Gregory A | -- | None Available | |
| Campbell Carolyn C | -- | -- |
Source: Public Records
Tax History Compared to Growth
Tax History
| Year | Tax Paid | Tax Assessment Tax Assessment Total Assessment is a certain percentage of the fair market value that is determined by local assessors to be the total taxable value of land and additions on the property. | Land | Improvement |
|---|---|---|---|---|
| 2025 | $1,725 | $81,018 | $22,801 | $65,217 |
| 2024 | $1,725 | $79,292 | $22,354 | $63,938 |
| 2023 | $1,658 | $84,601 | $21,916 | $62,685 |
| 2022 | $1,606 | $75,942 | $21,486 | $61,456 |
| 2021 | $1,574 | $74,316 | $21,065 | $60,251 |
| 2020 | $1,482 | $80,482 | $20,849 | $59,633 |
| 2019 | $1,469 | $78,904 | $20,440 | $58,464 |
| 2018 | $1,436 | $77,357 | $20,039 | $57,318 |
| 2017 | $1,400 | $75,840 | $19,646 | $56,194 |
| 2016 | $1,360 | $74,353 | $19,261 | $55,092 |
| 2015 | $1,327 | $73,237 | $18,972 | $54,265 |
| 2014 | $1,293 | $71,802 | $18,600 | $53,202 |
Source: Public Records
Map
Nearby Homes
- 43163 Grimmer Terrace
- 42932 Peachwood St
- 4860 Bryce Canyon Park Dr
- 48 Eagle Green
- 4537 Capewood Terrace
- 4533 Capewood Terrace
- 92 Delta Green
- 4309 Bora Ave
- 5341 Audubon Park Ct
- 262 Manitoba Green
- 202 Manitoba Terrace
- 208 Manitoba Terrace
- 41882 Gifford St
- 261 Manitoba Green Unit 261
- 257 Manitoba Green
- 4751 Wadsworth Ct
- 40696 Robin St
- 42759 Newport Dr
- 3923 Wildflower Common Unit 19
- 5560 Boscell Common
- 4753 Shelborne Park Ct
- 42823 Lido Park Ct
- 42741 Mayfair Park Ave
- 42737 Mayfair Park Ave
- 4765 Shelborne Park Ct
- 42824 Lido Park Ct
- 4756 Shelborne Park Ct
- 4760 Shelborne Park Ct
- 4752 Shelborne Park Ct
- 42733 Mayfair Park Ave
- 42745 Mayfair Park Ave
- 42821 Lido Park Ct
- 4762 Shelborne Park Ct
- 4771 Shelborne Park Ct
- 42729 Mayfair Park Ave
- 4790 Seneca Park Ave
- 4766 Shelborne Park Ct
- 42738 Mayfair Park Ave
- 4764 Shelborne Park Ct
- 4655 Flamingo Park Ct