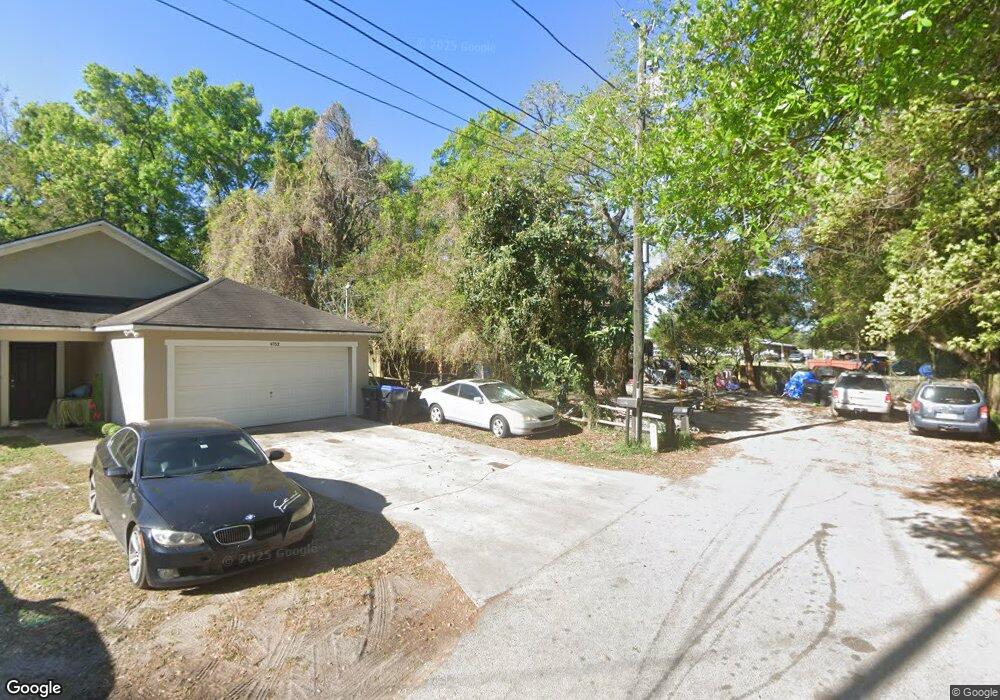
4758 Halliday Ln Orlando, FL 32810
Lockhart NeighborhoodEstimated Value: $162,000 - $242,000
2
Beds
1
Bath
858
Sq Ft
$255/Sq Ft
Est. Value
About This Home
This home is located at 4758 Halliday Ln, Orlando, FL 32810 and is currently estimated at $219,097, approximately $255 per square foot. 4758 Halliday Ln is a home located in Orange County with nearby schools including Riverside Elementary School, Lockhart Middle School, and Wekiva High School.
Ownership History
Date
Name
Owned For
Owner Type
Purchase Details
Closed on
Nov 17, 2023
Sold by
Rigdon Angela Della Jeanette Ilene
Bought by
Rigdon Jonathan Alan
Current Estimated Value
Purchase Details
Closed on
Aug 31, 2018
Sold by
Halliday Christopher M and Halliday Christen K
Bought by
Rigdon Jonathan Alan
Home Financials for this Owner
Home Financials are based on the most recent Mortgage that was taken out on this home.
Original Mortgage
$76,587
Interest Rate
4.87%
Mortgage Type
FHA
Purchase Details
Closed on
Nov 15, 2011
Sold by
Halliday Rosemary H
Bought by
Halliday Christopher M and Halliday Christen K
Purchase Details
Closed on
May 1, 2002
Sold by
M Trust R Halliday I
Bought by
Halliday Rosemary H
Purchase Details
Closed on
Sep 3, 1999
Sold by
Halliday Rosemary H and Halliday Christopher M
Bought by
Halliday Rosemary H
Create a Home Valuation Report for This Property
The Home Valuation Report is an in-depth analysis detailing your home's value as well as a comparison with similar homes in the area
Home Values in the Area
Average Home Value in this Area
Purchase History
| Date | Buyer | Sale Price | Title Company |
|---|---|---|---|
| Rigdon Jonathan Alan | $100 | None Listed On Document | |
| Rigdon Jonathan Alan | $78,000 | Fidelity National Title Of F | |
| Halliday Christopher M | $50,000 | Fidelity National Chicago | |
| Halliday Rosemary H | -- | -- | |
| Halliday Rosemary H | -- | -- |
Source: Public Records
Mortgage History
| Date | Status | Borrower | Loan Amount |
|---|---|---|---|
| Previous Owner | Rigdon Jonathan Alan | $76,587 |
Source: Public Records
Tax History
| Year | Tax Paid | Tax Assessment Tax Assessment Total Assessment is a certain percentage of the fair market value that is determined by local assessors to be the total taxable value of land and additions on the property. | Land | Improvement |
|---|---|---|---|---|
| 2025 | $2,569 | $130,321 | -- | -- |
| 2024 | $2,001 | $118,474 | -- | -- |
| 2023 | $2,001 | $128,740 | $30,000 | $98,740 |
| 2022 | $1,766 | $108,356 | $30,000 | $78,356 |
| 2021 | $1,594 | $90,504 | $25,000 | $65,504 |
| 2020 | $1,361 | $73,564 | $16,500 | $57,064 |
| 2019 | $1,443 | $74,824 | $16,500 | $58,324 |
| 2018 | $1,277 | $76,615 | $16,500 | $60,115 |
| 2017 | $1,059 | $52,924 | $15,000 | $37,924 |
| 2016 | $1,016 | $52,746 | $14,400 | $38,346 |
| 2015 | $984 | $50,623 | $12,000 | $38,623 |
| 2014 | $879 | $36,518 | $10,000 | $26,518 |
Source: Public Records
Map
Nearby Homes
- 6641 Pope Rd
- 4939 Clarcona Ocoee Rd
- 5268 Pinto Way
- 4988 Clarcona Ocoee Rd
- 4864 Old Oak Tree Ct
- 5410 Old Oak Tree Dr
- 4800 Old Oak Tree Ct
- 4714 Abaca St
- 5322 Regal Oak Cir
- 4485 Oak Arbor Cir
- 7151 Edgewater Shores Ct
- 7321 Edgewater Dr
- 4228 Sky Line Dr
- 5581 Aeolus Way
- 7219 Edgewater Shores Ct
- 5444 Lighthouse Rd
- 5417 Lighthouse Rd
- 5401 Lighthouse Rd
- 7513 Edgewater Dr
- 5601 N Pine Hills Rd
- 4752 Halliday Ln
- 6528 Booth Ln
- 4746 Halliday Ln
- 4740 Drummond Ln
- 4739 Halliday Ln
- 4766 Drummond Ln
- 4740 Halliday Ln
- 4737 Halliday Ln
- 4735 Halliday Ln
- 4734 Halliday Ln
- 5389 Rose Ave
- 4733 Halliday Ln
- 6534 Booth Ln
- 5337 Rose Ave
- 4741 Drummond Ln
- 5401 Rose Ave
- 5305 Rose Ave
- 4728 Halliday Ln
- 4782 Drummond Ln
- 5275 Rose Ave
Your Personal Tour Guide
Ask me questions while you tour the home.