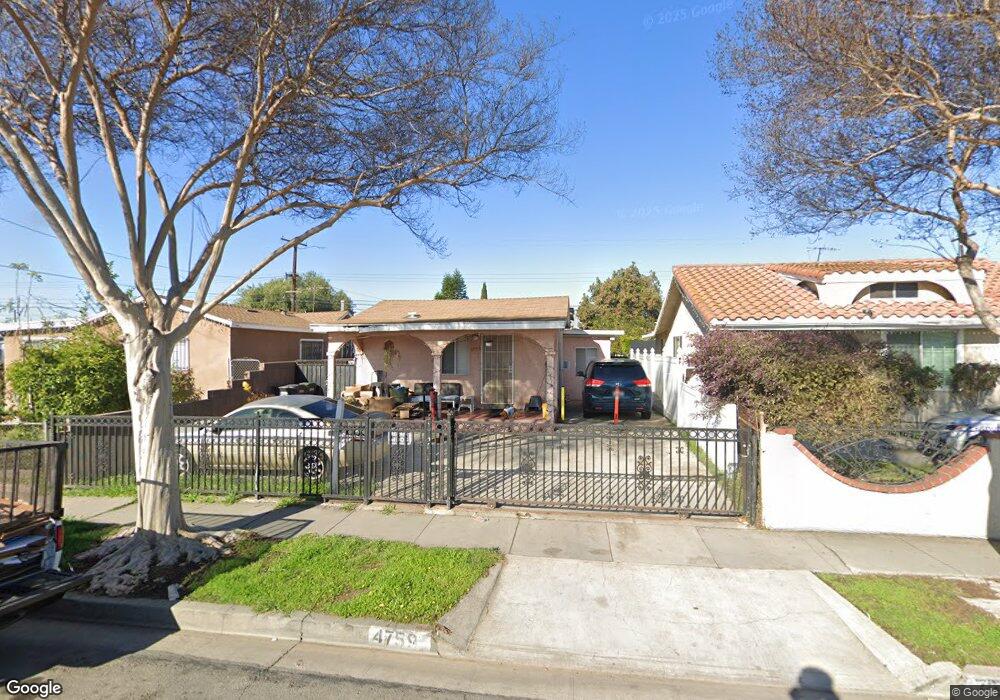
4759 Fir St Pico Rivera, CA 90660
Estimated Value: $592,000 - $673,532
3
Beds
2
Baths
1,024
Sq Ft
$624/Sq Ft
Est. Value
About This Home
This home is located at 4759 Fir St, Pico Rivera, CA 90660 and is currently estimated at $639,133, approximately $624 per square foot. 4759 Fir St is a home located in Los Angeles County with nearby schools including Montebello Gardens Elementary School, La Merced Intermediate School, and Montebello High School.
Ownership History
Date
Name
Owned For
Owner Type
Purchase Details
Closed on
Apr 21, 2006
Sold by
Monarrez Mabel
Bought by
Monarrez Victor
Current Estimated Value
Home Financials for this Owner
Home Financials are based on the most recent Mortgage that was taken out on this home.
Original Mortgage
$338,000
Outstanding Balance
$203,061
Interest Rate
1.75%
Mortgage Type
Negative Amortization
Estimated Equity
$436,072
Purchase Details
Closed on
Jan 29, 2004
Sold by
Cortez Jesus
Bought by
Monarrez Victor
Home Financials for this Owner
Home Financials are based on the most recent Mortgage that was taken out on this home.
Original Mortgage
$258,990
Interest Rate
5.79%
Mortgage Type
Purchase Money Mortgage
Purchase Details
Closed on
Sep 22, 2003
Sold by
Lopez Jose and Lopez Emilia
Bought by
Cortez Jesus
Purchase Details
Closed on
Mar 24, 1994
Sold by
Lopez Jose and Lopez Emilia
Bought by
Lopez Jose
Create a Home Valuation Report for This Property
The Home Valuation Report is an in-depth analysis detailing your home's value as well as a comparison with similar homes in the area
Home Values in the Area
Average Home Value in this Area
Purchase History
| Date | Buyer | Sale Price | Title Company |
|---|---|---|---|
| Monarrez Victor | -- | Alliance Title Company | |
| Monarrez Victor | $221,000 | Ticor Title Company | |
| Cortez Jesus | $195,000 | Fidelity National Title | |
| Lopez Jose | -- | -- |
Source: Public Records
Mortgage History
| Date | Status | Borrower | Loan Amount |
|---|---|---|---|
| Open | Monarrez Victor | $338,000 | |
| Previous Owner | Monarrez Victor | $258,990 |
Source: Public Records
Tax History Compared to Growth
Tax History
| Year | Tax Paid | Tax Assessment Tax Assessment Total Assessment is a certain percentage of the fair market value that is determined by local assessors to be the total taxable value of land and additions on the property. | Land | Improvement |
|---|---|---|---|---|
| 2025 | $5,592 | $411,256 | $314,671 | $96,585 |
| 2024 | $5,592 | $403,193 | $308,501 | $94,692 |
| 2023 | $5,584 | $395,288 | $302,452 | $92,836 |
| 2022 | $5,382 | $387,538 | $296,522 | $91,016 |
| 2021 | $5,145 | $379,940 | $290,708 | $89,232 |
| 2019 | $4,938 | $368,674 | $282,087 | $86,587 |
| 2018 | $4,942 | $361,446 | $276,556 | $84,890 |
| 2016 | $4,727 | $347,413 | $265,818 | $81,595 |
| 2015 | $4,454 | $342,196 | $261,826 | $80,370 |
| 2014 | $4,399 | $335,494 | $256,698 | $78,796 |
Source: Public Records
Map
Nearby Homes
- 4758 Oak St
- 4724 Orange St
- 4709 Grape St
- 4753 Orange St
- 4653 Pine St
- 8630 Elba St
- 8421 Culp Dr
- 272 Maiden Ln
- 4424 Calada Ave
- 4568 Los Toros Ave
- 424 Bradley Ave
- 4707 Rosemead Blvd
- 8509 Beverly Blvd
- 425 Valera Dr
- 4918 Rosemead Blvd
- 524 N Poplar Ave
- 416 W Cleveland Ave
- 5442 Zola Ave
- 525 N 3rd St
- 4115 Rosemead Blvd