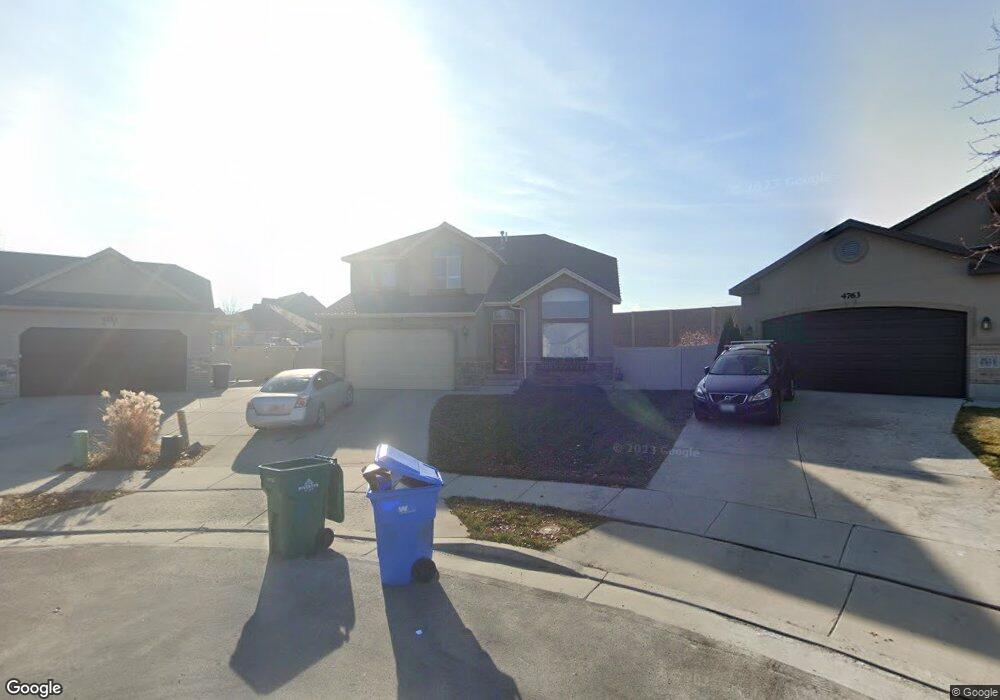
4759 Salish Cir Riverton, UT 84096
Estimated Value: $610,393 - $655,000
4
Beds
4
Baths
1,991
Sq Ft
$318/Sq Ft
Est. Value
About This Home
This home is located at 4759 Salish Cir, Riverton, UT 84096 and is currently estimated at $632,598, approximately $317 per square foot. 4759 Salish Cir is a home located in Salt Lake County with nearby schools including Midas Creek Elementary School, South Hills Middle School, and Mountain Ridge High School.
Ownership History
Date
Name
Owned For
Owner Type
Purchase Details
Closed on
Feb 23, 2011
Sold by
Tuft Christapher and Tuft Angela
Bought by
Ericson John M and Ericson Carma S
Current Estimated Value
Home Financials for this Owner
Home Financials are based on the most recent Mortgage that was taken out on this home.
Original Mortgage
$199,803
Outstanding Balance
$141,299
Interest Rate
5.5%
Mortgage Type
FHA
Estimated Equity
$491,299
Purchase Details
Closed on
Oct 31, 2005
Sold by
Perry Homes Utah Inc
Bought by
Tuft Christapher and Tuft Angela
Home Financials for this Owner
Home Financials are based on the most recent Mortgage that was taken out on this home.
Original Mortgage
$49,288
Interest Rate
5.3%
Mortgage Type
Stand Alone Second
Create a Home Valuation Report for This Property
The Home Valuation Report is an in-depth analysis detailing your home's value as well as a comparison with similar homes in the area
Home Values in the Area
Average Home Value in this Area
Purchase History
| Date | Buyer | Sale Price | Title Company |
|---|---|---|---|
| Ericson John M | -- | Surety Title | |
| Tuft Christapher | -- | Meridian Title | |
| Perry Homes Utah Inc | -- | Meridian Title |
Source: Public Records
Mortgage History
| Date | Status | Borrower | Loan Amount |
|---|---|---|---|
| Open | Ericson John M | $199,803 | |
| Previous Owner | Perry Homes Utah Inc | $49,288 | |
| Previous Owner | Tuft Christapher | $197,152 |
Source: Public Records
Tax History Compared to Growth
Tax History
| Year | Tax Paid | Tax Assessment Tax Assessment Total Assessment is a certain percentage of the fair market value that is determined by local assessors to be the total taxable value of land and additions on the property. | Land | Improvement |
|---|---|---|---|---|
| 2025 | $3,207 | $572,600 | $172,000 | $400,600 |
| 2024 | $3,207 | $555,000 | $166,700 | $388,300 |
| 2023 | $3,254 | $530,900 | $155,000 | $375,900 |
| 2022 | $3,384 | $541,600 | $152,000 | $389,600 |
| 2021 | $2,905 | $414,000 | $123,500 | $290,500 |
| 2020 | $2,804 | $372,500 | $98,800 | $273,700 |
| 2019 | $2,836 | $370,500 | $98,800 | $271,700 |
| 2018 | $2,689 | $345,900 | $95,800 | $250,100 |
| 2017 | $2,589 | $324,500 | $95,800 | $228,700 |
| 2016 | $2,484 | $298,800 | $90,700 | $208,100 |
| 2015 | $2,361 | $275,300 | $92,400 | $182,900 |
| 2014 | $2,264 | $258,800 | $88,100 | $170,700 |
Source: Public Records
Map
Nearby Homes
- 12801 Stormy Meadow Dr
- 12779 S Snow Flower Ct
- 4967 W Berry Creek Dr
- 5002 W Ticoa Ln
- 4933 W Pillar Dr
- 13032 S Tortola Dr Unit 201
- 12630 S Alpine Lake Ln Unit 202
- 4478 W Mandy Lee Cove
- 13221 S Dominica Ln Unit 303
- 13272 S Herriman Rose Blvd
- 13194 S Fort Herriman Pkwy Unit 44
- 13184 Newbridge Ln
- 5172 W Newbridge Ln
- 4768 W Liberation Dr
- 12531 S Huron Rd
- 12988 S Cohab Canyon Ct
- 12842 S Fairholme Cir
- 4758 Wagon Train Dr
- 13526 S Poole Dr Unit 301
- 13528 S Commodus Dr Unit L202
- 4759 W Salish Cir
- 4753 Salish Cir
- 4763 W Salish Cir
- 4763 Salish Cir
- 4758 W Kootenai Ct
- 4752 W Kootenai Ct
- 4747 Salish Cir
- 4747 W Salish Cir
- 4762 Salish Cir
- 4762 W Salish Cir
- 4744 W Kootenai Ct
- 4754 Salish Cir
- 4764 W Kootenai Ct
- 4737 Salish Cir
- 4737 W Salish Cir
- 4746 Salish Cir
- 4746 W Salish Cir
- 4736 W Kootenai Ct
- 4771 Western Hills Dr
- 4738 Salish Cir