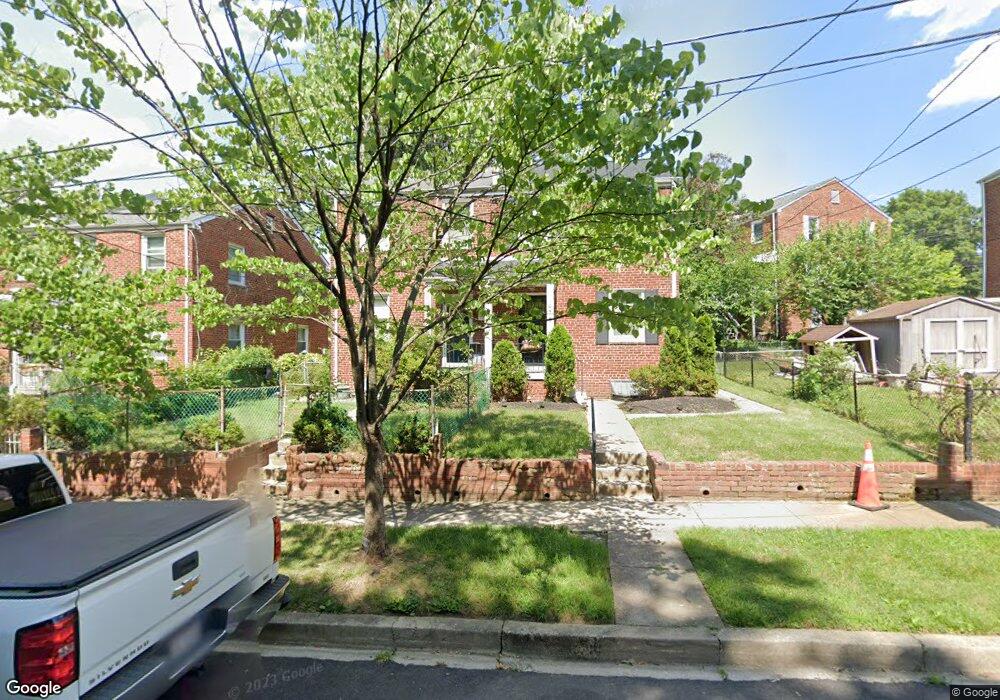
476 Burns St SE Washington, DC 20019
Benning Ridge NeighborhoodEstimated Value: $302,285 - $365,000
3
Beds
1
Bath
986
Sq Ft
$329/Sq Ft
Est. Value
About This Home
This home is located at 476 Burns St SE, Washington, DC 20019 and is currently estimated at $324,762, approximately $329 per square foot. 476 Burns St SE is a home located in District of Columbia with nearby schools including Plummer Elementary School, Sousa Middle School, and Anacostia High School.
Ownership History
Date
Name
Owned For
Owner Type
Purchase Details
Closed on
Sep 16, 1998
Sold by
Johnson Phyllis J
Bought by
Bush Alan L
Current Estimated Value
Home Financials for this Owner
Home Financials are based on the most recent Mortgage that was taken out on this home.
Original Mortgage
$93,098
Outstanding Balance
$19,388
Interest Rate
6.9%
Mortgage Type
FHA
Estimated Equity
$305,374
Create a Home Valuation Report for This Property
The Home Valuation Report is an in-depth analysis detailing your home's value as well as a comparison with similar homes in the area
Home Values in the Area
Average Home Value in this Area
Purchase History
| Date | Buyer | Sale Price | Title Company |
|---|---|---|---|
| Bush Alan L | $94,500 | -- |
Source: Public Records
Mortgage History
| Date | Status | Borrower | Loan Amount |
|---|---|---|---|
| Open | Bush Alan L | $93,098 |
Source: Public Records
Tax History
| Year | Tax Paid | Tax Assessment Tax Assessment Total Assessment is a certain percentage of the fair market value that is determined by local assessors to be the total taxable value of land and additions on the property. | Land | Improvement |
|---|---|---|---|---|
| 2025 | $1,400 | $313,550 | $153,410 | $160,140 |
| 2024 | $1,785 | $308,020 | $151,080 | $156,940 |
| 2023 | $1,646 | $302,260 | $148,240 | $154,020 |
| 2022 | $1,538 | $280,830 | $145,140 | $135,690 |
| 2021 | $1,416 | $261,080 | $138,470 | $122,610 |
| 2020 | $1,292 | $244,870 | $133,010 | $111,860 |
| 2019 | $1,181 | $232,940 | $128,560 | $104,380 |
| 2017 | $1,667 | $196,150 | $0 | $0 |
| 2016 | $1,519 | $178,750 | $0 | $0 |
Source: Public Records
Map
Nearby Homes
- 4313 F St SE
- 513 Hilltop Terrace SE
- 4346 G St SE
- 709 Adrian St SE
- 510 Ridge Rd SE Unit 102
- 514 Ridge Rd SE Unit 111
- 4348 D St SE
- 4243 Hildreth St SE
- 4263 Hildreth St SE
- 916 Hilltop Terrace SE
- 428 Ridge Rd SE Unit 205
- 4400 Dubois Place SE
- 1106 45th Place SE
- 3337 1/2 D St SE
- 4441 A St SE
- 1227 44th Place SE
- 4803 Bass Place SE
- 4649 H St SE
- 921 Ridge Rd SE
- 4820 C St SE Unit 103
- 478 Burns St SE
- 472 Burns St SE
- 470 Burns St SE
- 4320 Texas Ave SE
- 466 Burns St SE
- 4318 Texas Ave SE
- 4312 Texas Ave SE
- 464 Burns St SE
- 4310 Texas Ave SE
- 460 Burns St SE
- 491 Burbank St SE
- 489 Burbank St SE
- 481 Burbank St SE
- 475 Burbank St SE
- 483 Burbank St SE
- 454 Burns St SE
- 473 Burbank St SE
- 467 Burbank St SE
- 452 Burns St SE
- 465 Burbank St SE
Your Personal Tour Guide
Ask me questions while you tour the home.