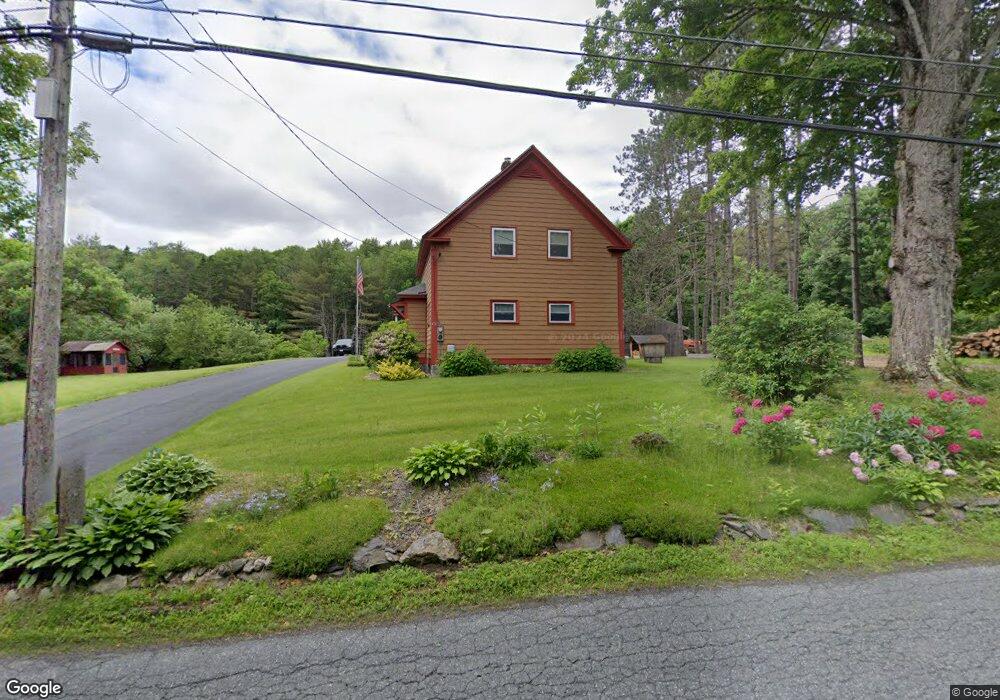
476 Elm St Claremont, NH 03743
East Claremont NeighborhoodEstimated Value: $405,000 - $638,000
4
Beds
3
Baths
3,252
Sq Ft
$158/Sq Ft
Est. Value
About This Home
This home is located at 476 Elm St, Claremont, NH 03743 and is currently estimated at $515,411, approximately $158 per square foot. 476 Elm St is a home located in Sullivan County with nearby schools including Disnard Elementary School, Claremont Middle School, and Stevens High School.
Ownership History
Date
Name
Owned For
Owner Type
Purchase Details
Closed on
Jul 30, 2025
Sold by
Bonin Richard L and Bonin Vivian L
Bought by
Bonin Ft and Bonin
Current Estimated Value
Purchase Details
Closed on
Jun 1, 1999
Sold by
Dilorenzo Margaret K
Bought by
Bonin Richard L and Bonin Vivian L
Home Financials for this Owner
Home Financials are based on the most recent Mortgage that was taken out on this home.
Original Mortgage
$89,600
Interest Rate
6.82%
Create a Home Valuation Report for This Property
The Home Valuation Report is an in-depth analysis detailing your home's value as well as a comparison with similar homes in the area
Home Values in the Area
Average Home Value in this Area
Purchase History
| Date | Buyer | Sale Price | Title Company |
|---|---|---|---|
| Bonin Ft | -- | -- | |
| Bonin Ft | -- | -- | |
| Bonin Richard L | $112,000 | -- | |
| Bonin Richard L | $112,000 | -- |
Source: Public Records
Mortgage History
| Date | Status | Borrower | Loan Amount |
|---|---|---|---|
| Previous Owner | Bonin Richard L | $89,600 |
Source: Public Records
Tax History Compared to Growth
Tax History
| Year | Tax Paid | Tax Assessment Tax Assessment Total Assessment is a certain percentage of the fair market value that is determined by local assessors to be the total taxable value of land and additions on the property. | Land | Improvement |
|---|---|---|---|---|
| 2024 | $11,174 | $381,900 | $52,400 | $329,500 |
| 2023 | $10,617 | $381,900 | $52,400 | $329,500 |
| 2022 | $9,507 | $228,100 | $26,600 | $201,500 |
| 2021 | $9,348 | $228,100 | $26,600 | $201,500 |
| 2020 | $9,288 | $228,100 | $26,600 | $201,500 |
| 2019 | $9,815 | $243,800 | $26,600 | $217,200 |
| 2018 | $10,188 | $242,100 | $26,600 | $215,500 |
| 2017 | $10,328 | $242,100 | $26,600 | $215,500 |
| 2016 | $10,156 | $238,300 | $26,600 | $211,700 |
| 2015 | $9,882 | $238,300 | $26,600 | $211,700 |
| 2014 | $9,849 | $238,300 | $26,600 | $211,700 |
| 2013 | $8,682 | $239,500 | $28,400 | $211,100 |
Source: Public Records
Map
Nearby Homes
- 0 Hanover St Unit 1
- 17 Alderwood Ct
- 614 Redwater Brook Rd
- 12 Emily Place
- 0 Slab City Rd Unit 5036741
- 48 Paddy Hollow Rd
- 6 Beauregard St
- 4 Anderson St
- 40 Citizen St
- 232 North St
- 211 North St
- 22 Royce St
- 28 Tutherly Ave
- 248 Main St
- 38 Washington St
- 0 Cat Hole Rd Unit 5052634
- 59 Lafayette St
- 8 Union St
- 58 Pearl St
- 50 School St