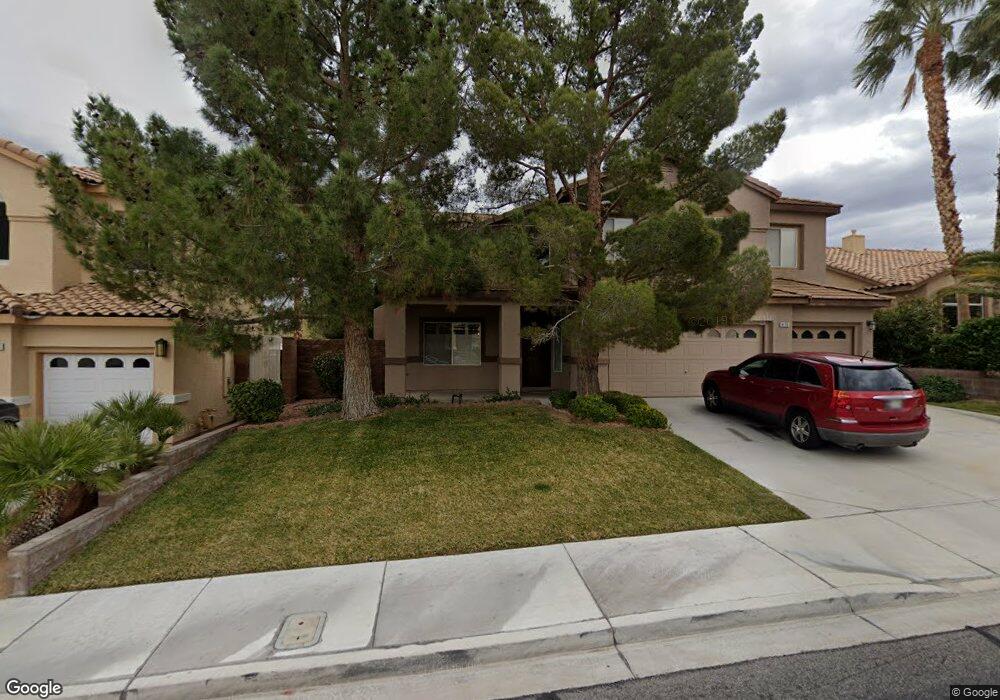
476 Mountain Heights Ct Henderson, NV 89052
Green Valley Ranch NeighborhoodEstimated Value: $669,124 - $794,000
5
Beds
3
Baths
2,673
Sq Ft
$268/Sq Ft
Est. Value
About This Home
This home is located at 476 Mountain Heights Ct, Henderson, NV 89052 and is currently estimated at $716,281, approximately $267 per square foot. 476 Mountain Heights Ct is a home located in Clark County with nearby schools including John Vanderburg Elementary School, Neil C. Twitchell Elementary School, and Bob Miller Middle School.
Ownership History
Date
Name
Owned For
Owner Type
Purchase Details
Closed on
Jan 16, 2024
Sold by
Rungaitis Robert D and Rungaitis Debra
Bought by
Rungaitis Robert D and Rungaitis Debra
Current Estimated Value
Purchase Details
Closed on
Mar 20, 2013
Sold by
Rungaitis Robert D
Bought by
Rungaitis Robert D
Home Financials for this Owner
Home Financials are based on the most recent Mortgage that was taken out on this home.
Original Mortgage
$435,000
Interest Rate
3.54%
Mortgage Type
Reverse Mortgage Home Equity Conversion Mortgage
Purchase Details
Closed on
May 8, 1996
Sold by
Green Valley Heights
Bought by
Rungaitis Robert D and Rungaitis Barbara
Home Financials for this Owner
Home Financials are based on the most recent Mortgage that was taken out on this home.
Original Mortgage
$202,100
Interest Rate
7.68%
Create a Home Valuation Report for This Property
The Home Valuation Report is an in-depth analysis detailing your home's value as well as a comparison with similar homes in the area
Home Values in the Area
Average Home Value in this Area
Purchase History
| Date | Buyer | Sale Price | Title Company |
|---|---|---|---|
| Rungaitis Robert D | -- | None Listed On Document | |
| Rungaitis Robert D | -- | None Listed On Document | |
| Rungaitis Robert D | -- | None Listed On Document | |
| Rungaitis Robert D | -- | None Listed On Document | |
| Rungaitis Robert D | -- | Fidelity National Title Las | |
| Rungaitis Robert D | $213,000 | Lawyers Title |
Source: Public Records
Mortgage History
| Date | Status | Borrower | Loan Amount |
|---|---|---|---|
| Previous Owner | Rungaitis Robert D | $435,000 | |
| Previous Owner | Rungaitis Robert D | $202,100 |
Source: Public Records
Tax History Compared to Growth
Tax History
| Year | Tax Paid | Tax Assessment Tax Assessment Total Assessment is a certain percentage of the fair market value that is determined by local assessors to be the total taxable value of land and additions on the property. | Land | Improvement |
|---|---|---|---|---|
| 2025 | $2,747 | $136,499 | $52,150 | $84,349 |
| 2024 | $2,667 | $136,499 | $52,150 | $84,349 |
| 2023 | $2,176 | $121,279 | $40,950 | $80,329 |
| 2022 | $2,590 | $112,717 | $39,200 | $73,517 |
| 2021 | $2,514 | $105,066 | $35,000 | $70,066 |
| 2020 | $2,438 | $103,160 | $33,600 | $69,560 |
| 2019 | $2,367 | $98,227 | $29,400 | $68,827 |
| 2018 | $2,298 | $91,821 | $25,900 | $65,921 |
| 2017 | $2,691 | $92,820 | $25,900 | $66,920 |
| 2016 | $2,176 | $85,188 | $16,800 | $68,388 |
| 2015 | $2,135 | $85,010 | $17,500 | $67,510 |
| 2014 | $2,108 | $72,299 | $10,500 | $61,799 |
Source: Public Records
Map
Nearby Homes
- 415 Golden State St
- 480 Mission Springs St
- 445 Golden State St
- 2255 Candlestick Ave
- 2221 Summerwind Cir
- 2257 Candlestick Ave
- 2265 Coral Ridge Ave
- 310 Fancrest St
- 438 Fountain Grove St
- 2272 Coral Ridge Ave
- 545 Teovani St Unit 1026
- 2171 High Mesa Dr
- 433 Piute Valley Ct
- 302 Doe Run Cir
- 487 Donavista Ct
- 2248 Alanhurst Dr
- 512 First Light St
- 2157 High Mesa Dr
- 2153 High Mesa Dr
- 2142 High Mesa Dr
- 474 Mountain Heights Ct
- 478 Mountain Heights Ct
- 472 Mountain Heights Ct
- 480 Mountain Heights Ct
- 475 Mountain Heights Ct
- 473 Mountain Heights Ct
- 477 Mountain Heights Ct
- 470 Mountain Heights Ct
- 482 Mountain Heights Ct
- 471 Mountain Heights Ct Unit 1
- 479 Mountain Heights Ct
- 413 Golden State St
- 468 Mountain Heights Ct
- 469 Mountain Heights Ct
- 481 Mountain Heights Ct
- 417 Golden State St
- 411 Golden State St
- 2202 Alanhurst Dr
- 419 Golden State St
- 2200 Alanhurst Dr