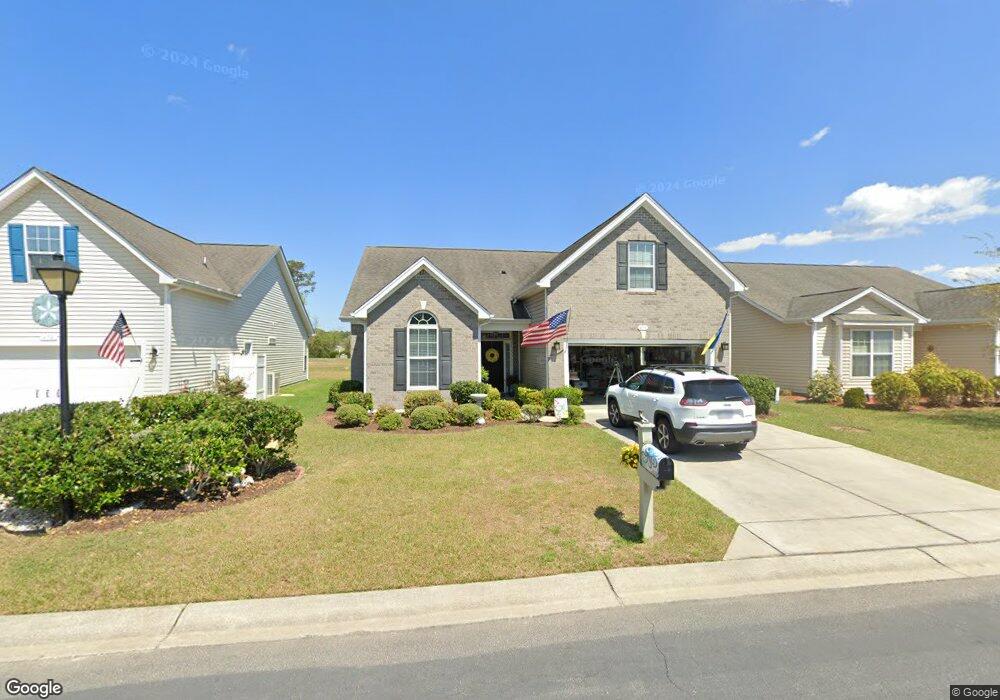
476 Slippery Rock Way Unit LOT 476; PHASE 10 Calabash, NC 28467
Estimated Value: $341,000 - $357,000
3
Beds
2
Baths
2,442
Sq Ft
$143/Sq Ft
Est. Value
About This Home
This home is located at 476 Slippery Rock Way Unit LOT 476; PHASE 10, Calabash, NC 28467 and is currently estimated at $349,162, approximately $142 per square foot. 476 Slippery Rock Way Unit LOT 476; PHASE 10 is a home located in Brunswick County with nearby schools including Jessie Mae Monroe Elementary School, Shallotte Middle School, and West Brunswick High School.
Ownership History
Date
Name
Owned For
Owner Type
Purchase Details
Closed on
May 12, 2025
Sold by
Christian Robert I
Bought by
Christian Anzhela
Current Estimated Value
Purchase Details
Closed on
Aug 23, 2022
Sold by
John J Larnick Revocable Trust
Bought by
Christian Robert I and Christian Anzhela
Purchase Details
Closed on
Jan 28, 2022
Sold by
Larnick John J
Bought by
Or His Successors In Trust
Purchase Details
Closed on
Mar 30, 2010
Sold by
D R Horton Inc
Bought by
Larnick John J
Home Financials for this Owner
Home Financials are based on the most recent Mortgage that was taken out on this home.
Original Mortgage
$70,000
Interest Rate
4.91%
Mortgage Type
New Conventional
Create a Home Valuation Report for This Property
The Home Valuation Report is an in-depth analysis detailing your home's value as well as a comparison with similar homes in the area
Home Values in the Area
Average Home Value in this Area
Purchase History
| Date | Buyer | Sale Price | Title Company |
|---|---|---|---|
| Christian Anzhela | -- | None Listed On Document | |
| Christian Robert I | $325,000 | Kirby Law Firm Pllc | |
| Or His Successors In Trust | -- | None Listed On Document | |
| Larnick John J | $185,000 | None Available |
Source: Public Records
Mortgage History
| Date | Status | Borrower | Loan Amount |
|---|---|---|---|
| Previous Owner | Larnick John J | $70,000 |
Source: Public Records
Tax History Compared to Growth
Tax History
| Year | Tax Paid | Tax Assessment Tax Assessment Total Assessment is a certain percentage of the fair market value that is determined by local assessors to be the total taxable value of land and additions on the property. | Land | Improvement |
|---|---|---|---|---|
| 2025 | $1,528 | $341,310 | $50,000 | $291,310 |
| 2024 | $1,528 | $338,040 | $50,000 | $288,040 |
| 2023 | $1,513 | $338,040 | $50,000 | $288,040 |
| 2022 | $1,513 | $223,850 | $40,000 | $183,850 |
| 2021 | $1,513 | $223,850 | $40,000 | $183,850 |
| 2020 | $1,469 | $223,850 | $40,000 | $183,850 |
| 2019 | $1,469 | $41,330 | $40,000 | $1,330 |
| 2018 | $1,274 | $26,560 | $25,000 | $1,560 |
| 2017 | $1,274 | $26,560 | $25,000 | $1,560 |
| 2016 | $1,249 | $26,560 | $25,000 | $1,560 |
| 2015 | $1,249 | $195,860 | $25,000 | $170,860 |
| 2014 | $1,129 | $189,169 | $25,000 | $164,169 |
Source: Public Records
Map
Nearby Homes
- 470 Slippery Rock Way
- 465 Slippery Rock Way
- 498 Slippery Rock Way
- 504 Slippery Rock Way
- 850 Meadow Ln SW
- 94 Field Planters Cir Unit 94
- 94 Field Planters Cir
- 90 Field Planters Cir
- 12 Calabash Lakes Blvd
- 3070 Crescent Lake Dr
- 3023 Cedar Creek Ln
- 1354 Fence Post Ln
- 1339 Sunny Slope Cir
- 558 Tullimore Ln NW
- 1345 Sunny Slope Cir
- 73 Field Planters Cir Unit 73
- 73 Field Planters Cir
- 7 Cattle Run Ln
- 19 Cattle Run Ln
- 1357 Sunny Slope Cir
- 476 Slippery Rock Way
- 478 Slippery Rock Way
- 474 Slippery Rock Way
- 474 Slippery Rock Way Unit 477
- 472 Slippery Rock Way
- 480 Slippery Rock Way
- 470 Slippery Rock Way Unit LOT 479; PHASE 10
- 470 Slippery Rock Way Unit 479
- 473 Slippery Rock Way
- 475 Slippery Rock Way
- 475 Slippery Rock1 Way
- 482 Slippery Rock Way
- 471 Slippery Rock Way
- 471 Slippery Rock Way Unit LOT 498; PHASE 10
- 471 Slippery Rock Way Unit The Farm at Brunswic
- 477 Slippery Rock Way
- 469 Slippery Rock Way
- 469 Slippery Rock Way Unit LOT 497; PHASE 10
- 469 Slippery Rock Way Unit 497
- 468 Slippery Rock Way