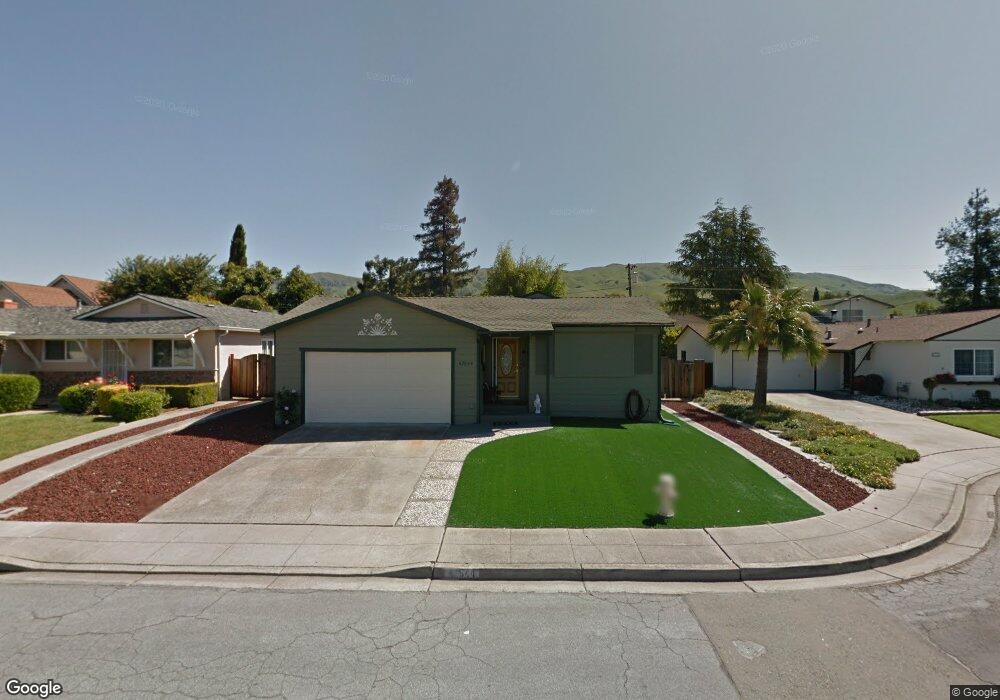
47644 Gridley Ct Fremont, CA 94539
Warm Springs NeighborhoodEstimated Value: $1,758,000 - $2,038,000
4
Beds
3
Baths
1,656
Sq Ft
$1,151/Sq Ft
Est. Value
About This Home
This home is located at 47644 Gridley Ct, Fremont, CA 94539 and is currently estimated at $1,905,582, approximately $1,150 per square foot. 47644 Gridley Ct is a home located in Alameda County with nearby schools including Warm Springs Elementary School, James Leitch Elementary School, and John M. Horner Junior High School.
Ownership History
Date
Name
Owned For
Owner Type
Purchase Details
Closed on
Jun 19, 2013
Sold by
Shimpi Shashank P and Shimpi Deepali B
Bought by
Shimpi Shashank P and Shimpi Deepali B
Current Estimated Value
Purchase Details
Closed on
Aug 9, 2012
Sold by
Garg Pradeep K and Garg Neelima
Bought by
Shimpi Shashank P and Shimpi Deepali B
Home Financials for this Owner
Home Financials are based on the most recent Mortgage that was taken out on this home.
Original Mortgage
$600,000
Outstanding Balance
$399,696
Interest Rate
2.87%
Mortgage Type
New Conventional
Estimated Equity
$1,505,886
Purchase Details
Closed on
Dec 21, 2011
Sold by
Taylor J and The J Taylor Revocable Trust
Bought by
Garg Pradeep K and Garg Neelima
Home Financials for this Owner
Home Financials are based on the most recent Mortgage that was taken out on this home.
Original Mortgage
$218,000
Interest Rate
3.94%
Mortgage Type
Seller Take Back
Purchase Details
Closed on
Aug 19, 2002
Sold by
Taylor Janet
Bought by
Taylor J and The J Taylor Revocable Trust
Create a Home Valuation Report for This Property
The Home Valuation Report is an in-depth analysis detailing your home's value as well as a comparison with similar homes in the area
Home Values in the Area
Average Home Value in this Area
Purchase History
| Date | Buyer | Sale Price | Title Company |
|---|---|---|---|
| Shimpi Shashank P | -- | None Available | |
| Shimpi Shashank P | $775,000 | Chicago Title Company | |
| Garg Pradeep K | $508,000 | Chicago Title Company | |
| Taylor J | -- | -- |
Source: Public Records
Mortgage History
| Date | Status | Borrower | Loan Amount |
|---|---|---|---|
| Open | Shimpi Shashank P | $600,000 | |
| Previous Owner | Garg Pradeep K | $218,000 |
Source: Public Records
Tax History Compared to Growth
Tax History
| Year | Tax Paid | Tax Assessment Tax Assessment Total Assessment is a certain percentage of the fair market value that is determined by local assessors to be the total taxable value of land and additions on the property. | Land | Improvement |
|---|---|---|---|---|
| 2025 | $11,425 | $954,318 | $286,295 | $668,023 |
| 2024 | $11,425 | $935,610 | $280,683 | $654,927 |
| 2023 | $11,123 | $917,266 | $275,180 | $642,086 |
| 2022 | $10,984 | $899,286 | $269,786 | $629,500 |
| 2021 | $10,715 | $881,654 | $264,496 | $617,158 |
| 2020 | $10,759 | $872,618 | $261,785 | $610,833 |
| 2019 | $10,637 | $855,514 | $256,654 | $598,860 |
| 2018 | $10,431 | $838,743 | $251,623 | $587,120 |
| 2017 | $10,171 | $822,297 | $246,689 | $575,608 |
| 2016 | $10,002 | $806,177 | $241,853 | $564,324 |
| 2015 | $9,872 | $794,071 | $238,221 | $555,850 |
| 2014 | $9,705 | $778,517 | $233,555 | $544,962 |
Source: Public Records
Map
Nearby Homes
- 47236 Cavanaugh Common
- 281 Hackamore Common
- 136 Hackamore Ln Unit 18
- 114 Hackamore Ln Unit 14
- 47222 Mission Falls Ct
- 524 E Warren Ave
- 46869 Fernald Common Unit 38
- 48287 Sawleaf St
- 472 Mayten Way
- 46762 Winema Common
- 296 Kansas Way
- 46935 Aloe Ct
- 46925 Aloe Ct
- 270 Tuolumne Dr
- 45897 Bridgeport Place
- 130 Kootenai Dr
- 145 Gamma Grass Terrace Unit U256
- 514 Bristle Grass Terrace
- 49002 Cinnamon Fern Common Unit 311
- 49100 Tomahawk Place
- 47636 Gridley Ct
- 47656 Gridley Ct
- 47624 Gridley Ct
- 47649 Pima St
- 47659 Pima St
- 47637 Pima St
- 47668 Gridley Ct
- 47643 Gridley Ct
- 47669 Pima St
- 47631 Gridley Ct
- 47612 Gridley Ct
- 47655 Gridley Ct
- 47679 Gridley Ct
- 304 Merrill Ave
- 47619 Gridley Ct
- 47679 Pima St
- 47667 Gridley Ct
- 312 Merrill Ave
- 47607 Gridley Ct
- 47662 Bannon Ct