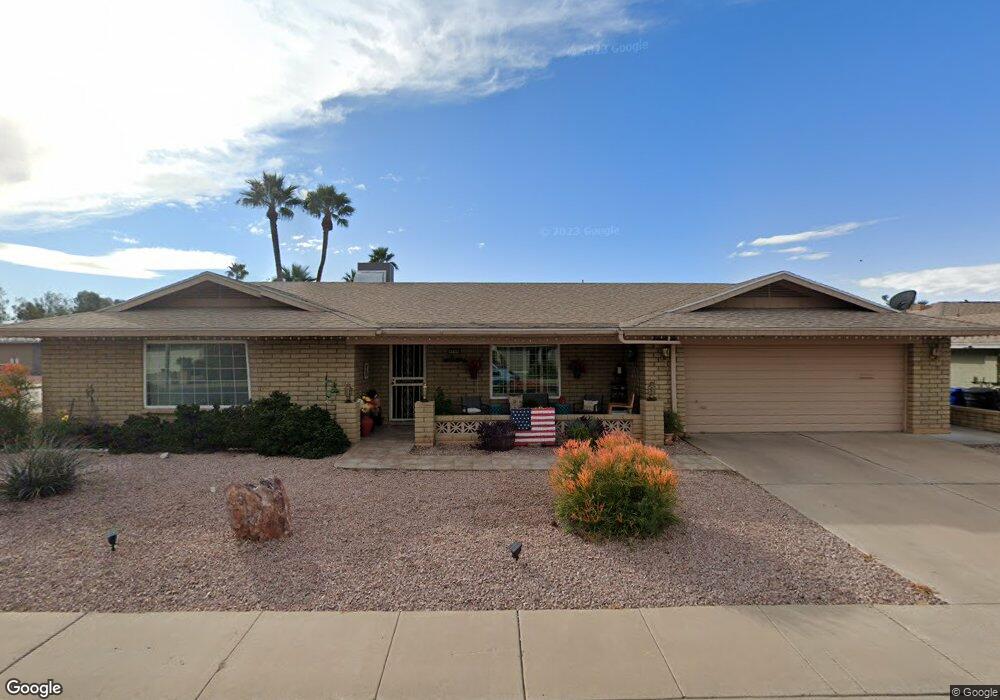
4765 E Delta Ave Mesa, AZ 85206
Sunland Village NeighborhoodEstimated Value: $379,264 - $451,000
3
Beds
3
Baths
2,251
Sq Ft
$191/Sq Ft
Est. Value
About This Home
This home is located at 4765 E Delta Ave, Mesa, AZ 85206 and is currently estimated at $429,066, approximately $190 per square foot. 4765 E Delta Ave is a home located in Maricopa County with nearby schools including Franklin at Brimhall Elementary School, Madison Elementary School, and Franklin West Elementary School.
Ownership History
Date
Name
Owned For
Owner Type
Purchase Details
Closed on
Dec 27, 2012
Sold by
Opsahl Allen C and Opsahl Allen C
Bought by
Camcort Properties Llc
Current Estimated Value
Purchase Details
Closed on
Sep 29, 2002
Sold by
Kemp Richard W and Kemp Ruth M
Bought by
Opsahl Roland C and Opsahl Dorothy K
Home Financials for this Owner
Home Financials are based on the most recent Mortgage that was taken out on this home.
Original Mortgage
$130,000
Interest Rate
4.87%
Mortgage Type
Purchase Money Mortgage
Purchase Details
Closed on
Jan 20, 2001
Sold by
Haan Delores A and Haan David E
Bought by
Kemp Richard W and Kemp Ruth M
Purchase Details
Closed on
Jun 3, 1999
Sold by
Haan David E and Haan Delores A
Bought by
Haan David E and Haan Delores A
Create a Home Valuation Report for This Property
The Home Valuation Report is an in-depth analysis detailing your home's value as well as a comparison with similar homes in the area
Home Values in the Area
Average Home Value in this Area
Purchase History
| Date | Buyer | Sale Price | Title Company |
|---|---|---|---|
| Camcort Properties Llc | -- | None Available | |
| Opsahl Roland C | $180,000 | Transnation Title Insurance | |
| Kemp Richard W | $171,900 | Transnation Title Insurance | |
| Haan David E | -- | -- | |
| Haan David E | -- | -- |
Source: Public Records
Mortgage History
| Date | Status | Borrower | Loan Amount |
|---|---|---|---|
| Previous Owner | Opsahl Roland C | $130,000 |
Source: Public Records
Tax History
| Year | Tax Paid | Tax Assessment Tax Assessment Total Assessment is a certain percentage of the fair market value that is determined by local assessors to be the total taxable value of land and additions on the property. | Land | Improvement |
|---|---|---|---|---|
| 2025 | $2,353 | $23,461 | -- | -- |
| 2024 | $2,360 | $22,344 | -- | -- |
| 2023 | $2,360 | $30,030 | $6,000 | $24,030 |
| 2022 | $2,312 | $24,710 | $4,940 | $19,770 |
| 2021 | $2,333 | $20,960 | $4,190 | $16,770 |
| 2020 | $2,302 | $21,270 | $4,250 | $17,020 |
| 2019 | $2,153 | $19,970 | $3,990 | $15,980 |
| 2018 | $2,065 | $18,780 | $3,750 | $15,030 |
| 2017 | $2,004 | $17,820 | $3,560 | $14,260 |
| 2016 | $1,966 | $17,510 | $3,500 | $14,010 |
| 2015 | $1,846 | $15,880 | $3,170 | $12,710 |
Source: Public Records
Map
Nearby Homes
- 4758 E Delta Ave
- 829 S Roanoke
- 4749 E Edgewood Ave
- 4654 E Escondido Ave
- 4709 E Edgewood Ave
- 913 S Roanoke
- 4632 E Escondido Ave
- 955 S Rochester
- 1025 S Roanoke
- 523 S Roanoke
- 542 S Higley Rd Unit 53
- 542 S Higley Rd Unit 90
- 542 S Higley Rd Unit 54
- 542 S Higley Rd Unit 89
- 542 S Higley Rd Unit 3
- 719 S Penrose Cir
- 4640 E Carol Ave
- 4734 E Florian Cir
- 552 S Rosemont
- 4648 E Florian Ave
- 4761 E Delta Ave
- 806 S Roanoke
- 801 S Roanoke
- 4808 E Delta Ave
- 4766 E Delta Ave
- 803 S Reseda
- 4753 E Delta Ave
- 805 S Roanoke
- 4814 E Delta Ave
- 814 S Roanoke
- 802 S Reseda
- 4820 E Delta Ave
- 813 S Roanoke
- 4827 E Delta Ave
- 4752 E Delta Ave
- 811 S Reseda
- 822 S Roanoke
- 808 S Rochester
- 4826 E Delta Ave
- 821 S Roanoke
Your Personal Tour Guide
Ask me questions while you tour the home.