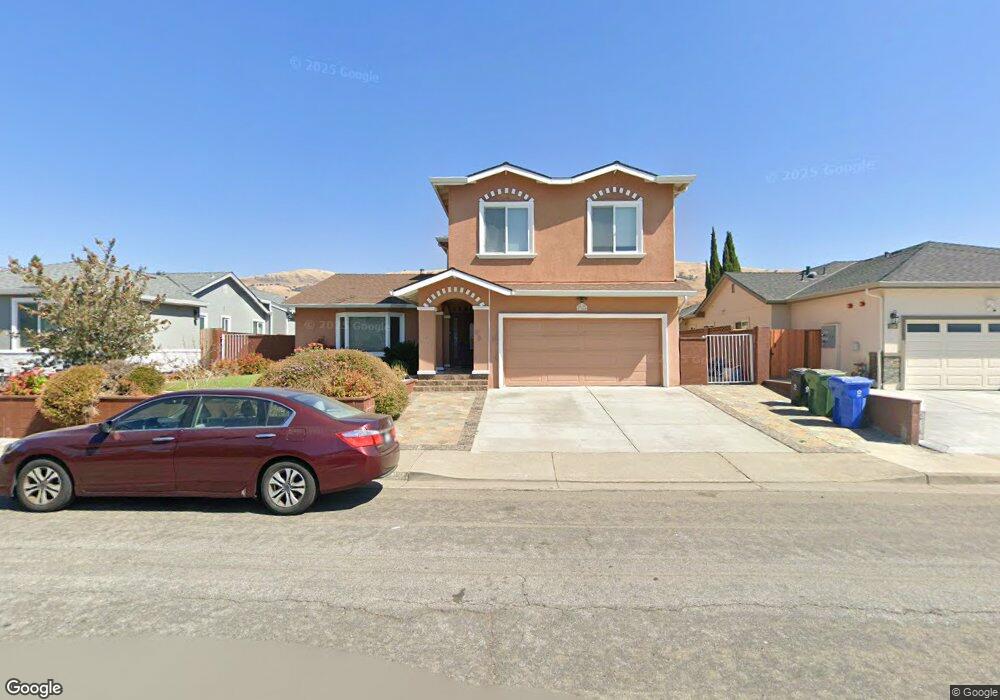
47666 Hoyt St Fremont, CA 94539
Warm Springs NeighborhoodEstimated Value: $2,167,000 - $2,746,747
4
Beds
4
Baths
2,612
Sq Ft
$958/Sq Ft
Est. Value
About This Home
This home is located at 47666 Hoyt St, Fremont, CA 94539 and is currently estimated at $2,502,687, approximately $958 per square foot. 47666 Hoyt St is a home located in Alameda County with nearby schools including Warm Springs Elementary School, James Leitch Elementary School, and John M. Horner Junior High School.
Ownership History
Date
Name
Owned For
Owner Type
Purchase Details
Closed on
May 21, 2019
Sold by
Nayak Pranamya R and Kumar Shruthi Hebbur Prasanna
Bought by
Nayak Pranamya R and Kumar Shruthi Hebbur Prasanna
Current Estimated Value
Purchase Details
Closed on
May 30, 2018
Sold by
Srinivas Sudhir and Saxena Suman
Bought by
Nayak Pranamya Raghuveer and Kumar Shruthi Hebbur Prasanna
Home Financials for this Owner
Home Financials are based on the most recent Mortgage that was taken out on this home.
Original Mortgage
$1,499,517
Outstanding Balance
$1,270,021
Interest Rate
3.62%
Mortgage Type
Adjustable Rate Mortgage/ARM
Estimated Equity
$1,232,666
Purchase Details
Closed on
Mar 15, 2000
Sold by
Hallock Gary L and Hallock Katrina M
Bought by
Srinivas Sudhir and Saxena Suman
Home Financials for this Owner
Home Financials are based on the most recent Mortgage that was taken out on this home.
Original Mortgage
$378,400
Interest Rate
7.75%
Create a Home Valuation Report for This Property
The Home Valuation Report is an in-depth analysis detailing your home's value as well as a comparison with similar homes in the area
Home Values in the Area
Average Home Value in this Area
Purchase History
| Date | Buyer | Sale Price | Title Company |
|---|---|---|---|
| Nayak Pranamya R | -- | None Available | |
| Nayak Pranamya Raghuveer | $1,885,000 | First American Title Company | |
| Srinivas Sudhir | $473,000 | Old Republic Title Company |
Source: Public Records
Mortgage History
| Date | Status | Borrower | Loan Amount |
|---|---|---|---|
| Open | Nayak Pranamya Raghuveer | $1,499,517 | |
| Previous Owner | Srinivas Sudhir | $378,400 |
Source: Public Records
Tax History Compared to Growth
Tax History
| Year | Tax Paid | Tax Assessment Tax Assessment Total Assessment is a certain percentage of the fair market value that is determined by local assessors to be the total taxable value of land and additions on the property. | Land | Improvement |
|---|---|---|---|---|
| 2025 | $24,645 | $2,144,771 | $665,618 | $1,479,153 |
| 2024 | $24,645 | $2,102,717 | $652,567 | $1,450,150 |
| 2023 | $24,020 | $2,061,492 | $639,773 | $1,421,719 |
| 2022 | $23,761 | $2,021,078 | $627,231 | $1,393,847 |
| 2021 | $21,791 | $1,860,000 | $558,000 | $1,302,000 |
| 2020 | $23,396 | $1,961,154 | $608,634 | $1,352,520 |
| 2019 | $23,122 | $1,922,700 | $596,700 | $1,326,000 |
| 2018 | $9,534 | $769,167 | $191,672 | $577,495 |
| 2017 | $9,296 | $754,089 | $187,915 | $566,174 |
| 2016 | $9,138 | $739,306 | $184,231 | $555,075 |
| 2015 | $9,016 | $728,203 | $181,464 | $546,739 |
| 2014 | $8,861 | $713,938 | $177,909 | $536,029 |
Source: Public Records
Map
Nearby Homes
- 47236 Cavanaugh Common
- 281 Hackamore Common
- 136 Hackamore Ln Unit 18
- 114 Hackamore Ln Unit 14
- 48346 Cottonwood St
- 47222 Mission Falls Ct
- 199 E Warren Common
- 524 E Warren Ave
- 48287 Sawleaf St
- 46869 Fernald Common Unit 38
- 296 Kansas Way
- 46762 Winema Common
- 46935 Aloe Ct
- 46925 Aloe Ct
- 270 Tuolumne Dr
- 145 Gamma Grass Terrace Unit U256
- 130 Kootenai Dr
- 45897 Bridgeport Place
- 49002 Cinnamon Fern Common Unit 311
- 49100 Tomahawk Place