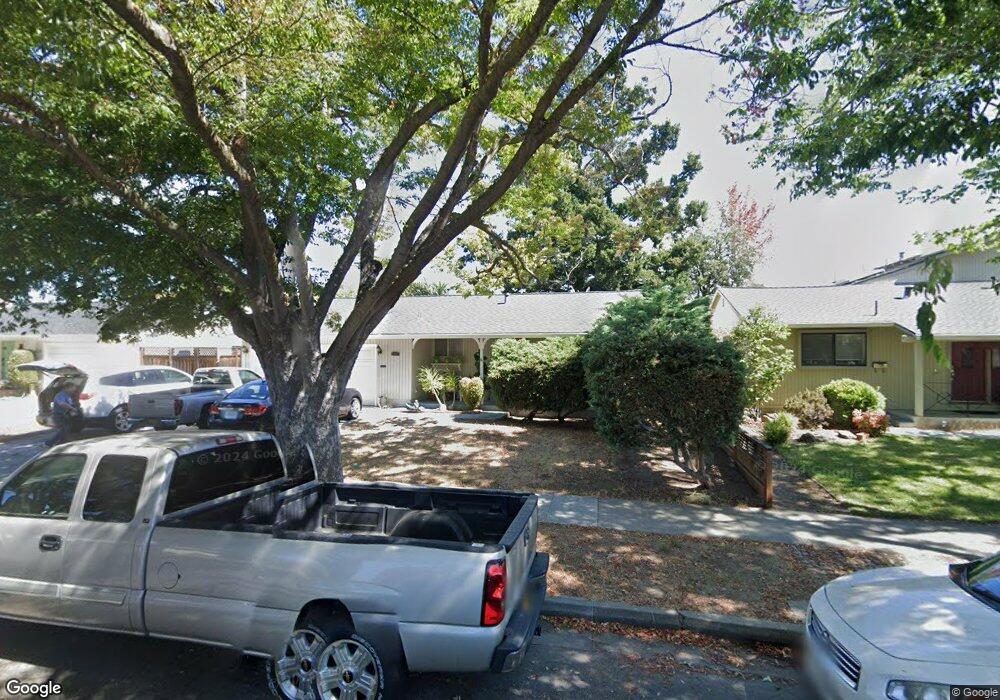
4767 Englewood Dr San Jose, CA 95129
Country Lane NeighborhoodEstimated Value: $2,294,059 - $2,466,000
3
Beds
2
Baths
1,364
Sq Ft
$1,732/Sq Ft
Est. Value
About This Home
This home is located at 4767 Englewood Dr, San Jose, CA 95129 and is currently estimated at $2,362,265, approximately $1,731 per square foot. 4767 Englewood Dr is a home located in Santa Clara County with nearby schools including Country Lane Elementary School, Moreland Middle School, and Prospect High School.
Ownership History
Date
Name
Owned For
Owner Type
Purchase Details
Closed on
Sep 25, 2019
Sold by
Hargraves David M and Hargraves Linda R
Bought by
Hargraves David M and Hargraves Linda R
Current Estimated Value
Purchase Details
Closed on
Apr 30, 2012
Sold by
Hargraves David M and Hargraves Linda R
Bought by
Hargraves David M and Hargraves Linda R
Home Financials for this Owner
Home Financials are based on the most recent Mortgage that was taken out on this home.
Original Mortgage
$140,000
Interest Rate
3.94%
Mortgage Type
Purchase Money Mortgage
Purchase Details
Closed on
Jun 19, 2000
Sold by
Kinney Ralph D and Linda Hargraves David And
Bought by
Hargraves David M and Hargraves Linda R
Home Financials for this Owner
Home Financials are based on the most recent Mortgage that was taken out on this home.
Original Mortgage
$215,000
Interest Rate
8.53%
Purchase Details
Closed on
Jan 29, 1998
Sold by
Root Miriam R
Bought by
Kinney Ralph
Purchase Details
Closed on
Jan 27, 1997
Sold by
Root Miriam R
Bought by
Hargraves David and Hargraves Linda
Purchase Details
Closed on
Jan 18, 1996
Sold by
Root Miriam R
Bought by
Hargraves David and Hargraves Linda
Purchase Details
Closed on
Nov 16, 1995
Sold by
Root Miriam R
Bought by
Hargraves David and Hargraves Linda
Create a Home Valuation Report for This Property
The Home Valuation Report is an in-depth analysis detailing your home's value as well as a comparison with similar homes in the area
Home Values in the Area
Average Home Value in this Area
Purchase History
| Date | Buyer | Sale Price | Title Company |
|---|---|---|---|
| Hargraves David M | -- | None Available | |
| Hargraves David M | -- | North American Title Company | |
| Hargraves David M | -- | Commonwealth Land Title Co | |
| Kinney Ralph | -- | -- | |
| Hargraves David | -- | -- | |
| Hargraves David | -- | -- | |
| Hargraves David | -- | -- |
Source: Public Records
Mortgage History
| Date | Status | Borrower | Loan Amount |
|---|---|---|---|
| Previous Owner | Hargraves David M | $140,000 | |
| Previous Owner | Hargraves David M | $215,000 |
Source: Public Records
Tax History Compared to Growth
Tax History
| Year | Tax Paid | Tax Assessment Tax Assessment Total Assessment is a certain percentage of the fair market value that is determined by local assessors to be the total taxable value of land and additions on the property. | Land | Improvement |
|---|---|---|---|---|
| 2025 | $5,201 | $293,000 | $205,459 | $87,541 |
| 2024 | $5,201 | $287,256 | $201,431 | $85,825 |
| 2023 | $5,092 | $281,625 | $197,482 | $84,143 |
| 2022 | $5,018 | $276,104 | $193,610 | $82,494 |
| 2021 | $4,882 | $270,691 | $189,814 | $80,877 |
| 2020 | $4,745 | $267,916 | $187,868 | $80,048 |
| 2019 | $4,570 | $262,664 | $184,185 | $78,479 |
| 2018 | $4,456 | $257,515 | $180,574 | $76,941 |
| 2017 | $4,393 | $252,467 | $177,034 | $75,433 |
| 2016 | $4,140 | $247,517 | $173,563 | $73,954 |
| 2015 | $4,095 | $243,800 | $170,956 | $72,844 |
| 2014 | $3,629 | $239,026 | $167,608 | $71,418 |
Source: Public Records
Map
Nearby Homes
- 1370 Saratoga Ave
- 1364 Saratoga Ave
- 4640 Venice Way
- 4497 Latimer Ave
- 5187 Doyle Rd
- 5043 Le Miccine Terrace Unit 76
- 1367 Cordelia Ave
- 1055 Happy Valley Ave
- 1607 Duvall Dr
- 1154 Bentoak Ln
- 1310 Rosalia Ave
- 4117 De Mille Dr
- 4470 Borina Dr
- 3936 Braeburn Ct
- 3928 Caxton Ct
- 5635 W Walbrook Dr
- 1918 Castro Dr
- 4020 Williams Rd Unit 8
- 1438 Stockbridge Dr
- 810 Raintree Dr
- 4779 Englewood Dr
- 4757 Englewood Dr
- 4745 Englewood Dr
- 4793 Englewood Dr
- 4794 Clarendon Dr
- 4814 Clarendon Dr
- 4772 Clarendon Dr
- 4834 Clarendon Dr
- 4733 Englewood Dr
- 4805 Englewood Dr
- 4750 Clarendon Dr
- 4768 Englewood Dr
- 4780 Englewood Dr
- 4854 Clarendon Dr
- 4756 Englewood Dr
- 4792 Englewood Dr
- 4730 Clarendon Dr
- 4744 Englewood Dr
- 4721 Englewood Dr
- 4817 Englewood Dr