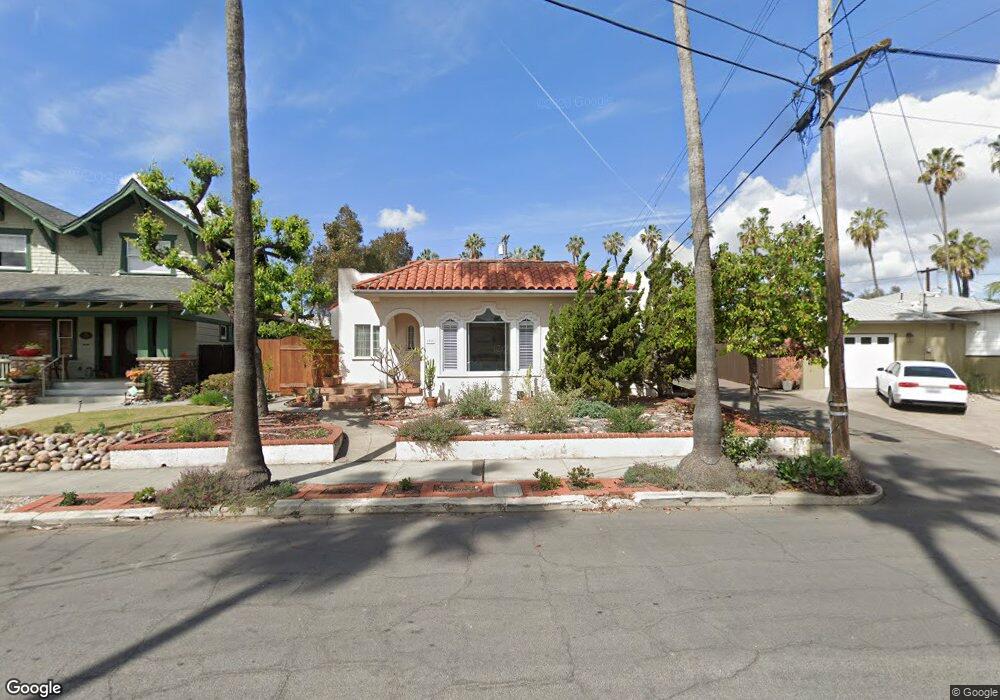
4767 Panorama Dr San Diego, CA 92116
University Heights NeighborhoodEstimated Value: $1,475,000 - $2,380,000
3
Beds
3
Baths
2,255
Sq Ft
$808/Sq Ft
Est. Value
About This Home
This home is located at 4767 Panorama Dr, San Diego, CA 92116 and is currently estimated at $1,823,006, approximately $808 per square foot. 4767 Panorama Dr is a home located in San Diego County with nearby schools including Birney Elementary School, Roosevelt International Middle School, and San Diego Global Vision Academy.
Ownership History
Date
Name
Owned For
Owner Type
Purchase Details
Closed on
Aug 19, 2022
Sold by
Carr Lawrence and Carr Sarah
Bought by
Lawrence Carr And Sarah Ramos 2022 Trust
Current Estimated Value
Purchase Details
Closed on
Feb 23, 2012
Sold by
Carr Lawrence R
Bought by
Carr Lawrence R and Ramos Sarah M
Purchase Details
Closed on
Jun 9, 2003
Sold by
Carr Lawrence R
Bought by
Carr Lawrence R
Purchase Details
Closed on
Dec 31, 2001
Sold by
Carr Lawrence R and Ramos Sarah
Bought by
Carr Lawrence R
Home Financials for this Owner
Home Financials are based on the most recent Mortgage that was taken out on this home.
Original Mortgage
$260,000
Interest Rate
6.2%
Purchase Details
Closed on
Jun 24, 1996
Sold by
Hobbs Family Trust 10-22-91 and Driscoll Eugene J
Bought by
Carr Lawrence R
Purchase Details
Closed on
Dec 16, 1988
Create a Home Valuation Report for This Property
The Home Valuation Report is an in-depth analysis detailing your home's value as well as a comparison with similar homes in the area
Home Values in the Area
Average Home Value in this Area
Purchase History
| Date | Buyer | Sale Price | Title Company |
|---|---|---|---|
| Lawrence Carr And Sarah Ramos 2022 Trust | -- | -- | |
| Carr Lawrence | -- | -- | |
| Carr Lawrence R | -- | Lsi Title Company | |
| Carr Lawrence R | -- | None Available | |
| Carr Lawrence R | -- | Old Republic Title Company | |
| Carr Lawrence R | -- | Old Republic Title Company | |
| -- | $212,500 | -- |
Source: Public Records
Mortgage History
| Date | Status | Borrower | Loan Amount |
|---|---|---|---|
| Previous Owner | Carr Lawrence R | $260,000 |
Source: Public Records
Tax History Compared to Growth
Tax History
| Year | Tax Paid | Tax Assessment Tax Assessment Total Assessment is a certain percentage of the fair market value that is determined by local assessors to be the total taxable value of land and additions on the property. | Land | Improvement |
|---|---|---|---|---|
| 2025 | $6,138 | $514,010 | $206,408 | $307,602 |
| 2024 | $6,138 | $503,932 | $202,361 | $301,571 |
| 2023 | $6,000 | $494,052 | $198,394 | $295,658 |
| 2022 | $5,839 | $484,365 | $194,504 | $289,861 |
| 2021 | $5,798 | $474,869 | $190,691 | $284,178 |
| 2020 | $5,727 | $470,001 | $188,736 | $281,265 |
| 2019 | $5,623 | $460,786 | $185,036 | $275,750 |
| 2018 | $5,257 | $451,752 | $181,408 | $270,344 |
| 2017 | $80 | $442,895 | $177,851 | $265,044 |
| 2016 | $5,046 | $434,212 | $174,364 | $259,848 |
| 2015 | $4,971 | $427,690 | $171,745 | $255,945 |
| 2014 | $4,892 | $419,313 | $168,381 | $250,932 |
Source: Public Records
Map
Nearby Homes
- 2436 Adams Ave
- 4714-16 Arizona St
- 4621 Alabama St
- 4722 Oregon St
- 4612 Hamilton St
- 4838 Idaho St
- 4545 Arizona St Unit 101
- 4545 Arizona St Unit 107
- 4665 Oregon St Unit 6
- 4915 Uvada Place
- 4502 Texas St
- 4518 Arizona St
- 4479 Louisiana St Unit 7
- 2820 Adams Ave
- 4657 Idaho St
- 2050 Camino de la Reina Unit 3305
- 4655-4663 Campus Ave Unit 9, 11&12
- 4425 Louisiana St Unit 2
- 4971 Vista Place Unit B
- 2930 Copley Ave
- 4769 Panorama Dr
- 4761 Panorama Dr
- 4771 Panorama Dr
- 4755 Panorama Dr
- 4739 Panorama Dr
- 4751 Panorama Dr
- 4737 Panorama Dr
- 4773 Panorama Dr
- 4741 Panorama Dr
- 4770 Panorama Dr
- 4747 Panorama Dr
- 4735 Panorama Dr
- 4775 Panorama Dr
- 4733 Panorama Dr
- 4774 Panorama Dr
- 4762 Panorama Dr
- 4731 Panorama Dr
- 4779 Panorama Dr
- 4760 Panorama Dr
- 4776 Panorama Dr