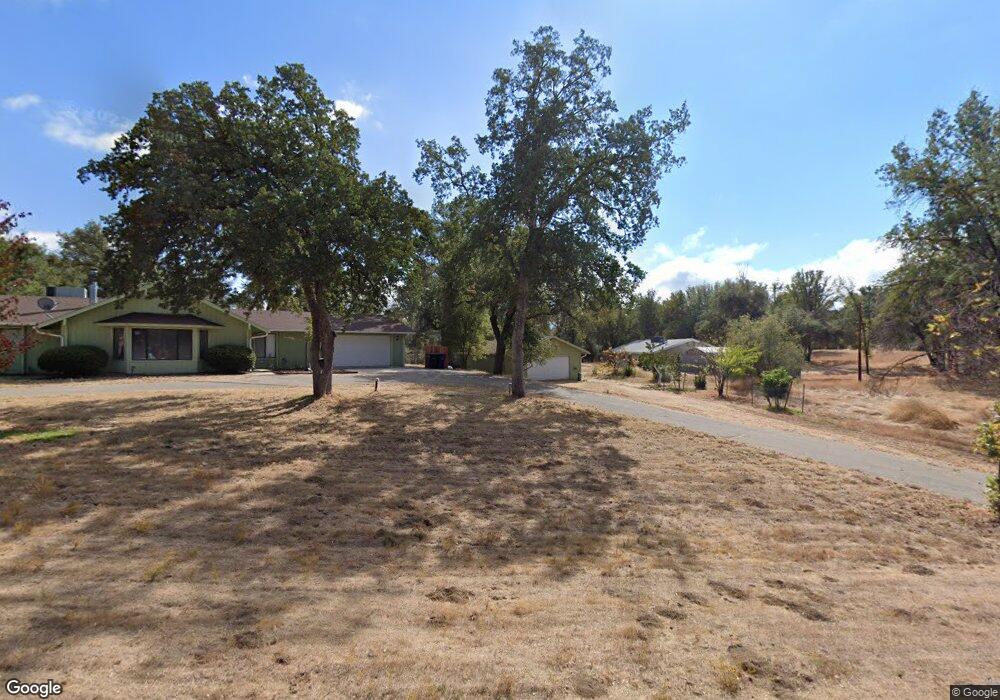
47678 Delaware Ct Coarsegold, CA 93614
Estimated Value: $340,000 - $432,000
3
Beds
3
Baths
1,986
Sq Ft
$198/Sq Ft
Est. Value
About This Home
This home is located at 47678 Delaware Ct, Coarsegold, CA 93614 and is currently estimated at $394,102, approximately $198 per square foot. 47678 Delaware Ct is a home located in Madera County.
Ownership History
Date
Name
Owned For
Owner Type
Purchase Details
Closed on
Apr 29, 2021
Sold by
Custodio Xenia
Bought by
Cromer Shane Christopher
Current Estimated Value
Home Financials for this Owner
Home Financials are based on the most recent Mortgage that was taken out on this home.
Original Mortgage
$313,500
Outstanding Balance
$283,053
Interest Rate
3%
Mortgage Type
New Conventional
Estimated Equity
$111,049
Purchase Details
Closed on
Apr 22, 2021
Sold by
Favalaora Jackie Renee and Favalaora Jackie R
Bought by
Cromer Shane Christopher
Home Financials for this Owner
Home Financials are based on the most recent Mortgage that was taken out on this home.
Original Mortgage
$313,500
Outstanding Balance
$283,053
Interest Rate
3%
Mortgage Type
New Conventional
Estimated Equity
$111,049
Purchase Details
Closed on
Apr 5, 2007
Sold by
Smith Foster E and Smith Marjorie A
Bought by
Favalora Dominic J and Favalora Jackie R
Create a Home Valuation Report for This Property
The Home Valuation Report is an in-depth analysis detailing your home's value as well as a comparison with similar homes in the area
Home Values in the Area
Average Home Value in this Area
Purchase History
| Date | Buyer | Sale Price | Title Company |
|---|---|---|---|
| Cromer Shane Christopher | -- | Chicago Title Company | |
| Cromer Shane Christopher | $333,000 | Chicago Title Company | |
| Favalora Dominic J | $280,000 | Chicago Title Company |
Source: Public Records
Mortgage History
| Date | Status | Borrower | Loan Amount |
|---|---|---|---|
| Open | Cromer Shane Christopher | $313,500 |
Source: Public Records
Tax History
| Year | Tax Paid | Tax Assessment Tax Assessment Total Assessment is a certain percentage of the fair market value that is determined by local assessors to be the total taxable value of land and additions on the property. | Land | Improvement |
|---|---|---|---|---|
| 2025 | $3,699 | $360,447 | $32,472 | $327,975 |
| 2023 | $3,699 | $346,453 | $31,212 | $315,241 |
| 2022 | $3,616 | $339,660 | $30,600 | $309,060 |
| 2021 | $3,484 | $327,630 | $145,611 | $182,019 |
| 2020 | $3,473 | $324,271 | $144,118 | $180,153 |
| 2019 | $3,411 | $317,914 | $141,293 | $176,621 |
| 2018 | $3,221 | $300,550 | $127,392 | $173,158 |
| 2017 | $2,900 | $267,632 | $111,747 | $155,885 |
| 2016 | $2,767 | $259,837 | $108,492 | $151,345 |
| 2015 | $2,523 | $236,215 | $98,629 | $137,586 |
| 2014 | $2,338 | $216,711 | $90,485 | $126,226 |
Source: Public Records
Map
Nearby Homes
- 31729 Cherokee Rd
- 47651 Klamath Ave
- 31367 Delaware Rd
- 31325 Delaware Rd
- 47412 Blackfoot Ct
- 32413 Chickasaw Rd
- 0 Chickasaw Rd
- 31364 Quartz Mountain Rd
- 31140 Quartz Mountain Rd
- 47684 Willow Pond Way
- 1234 Quartz Mountain Rd
- 123 Quartz Mountain Rd
- 31678 Buck Run Ln
- 30301 Longview Ln E
- 46320 Oonay Nation Rd
- 45991 Black Oak Rd
- 46304 Skyline Ridge Rd
- 0 Hogans Mountain Rd Unit MP23147543
- 31076 Hogans Mountain Rd
- 0 Sunshine Terrace Dr Unit FR24180116
- 31853 Delaware Rd
- 31882 Delaware Rd
- 47694 Delaware Ct
- 47675 Delaware Ct
- 31830 Delaware Rd
- 31908 Delaware Rd
- 47702 Delaware Ct
- 31814 Delaware Rd
- 31801 Cherokee Rd
- 47712 Delaware Ct
- 31949 Delaware Rd
- 31940 Delaware Rd
- 47701 Delaware Ct
- 31867 Cherokee Rd
- 31767 Cherokee Rd
- 31780 Delaware Rd
- 31835 Cherokee Rd
- 47780 Seminole Ave
- 31901 Cherokee Rd
- 47744 Seminole Ave
Your Personal Tour Guide
Ask me questions while you tour the home.