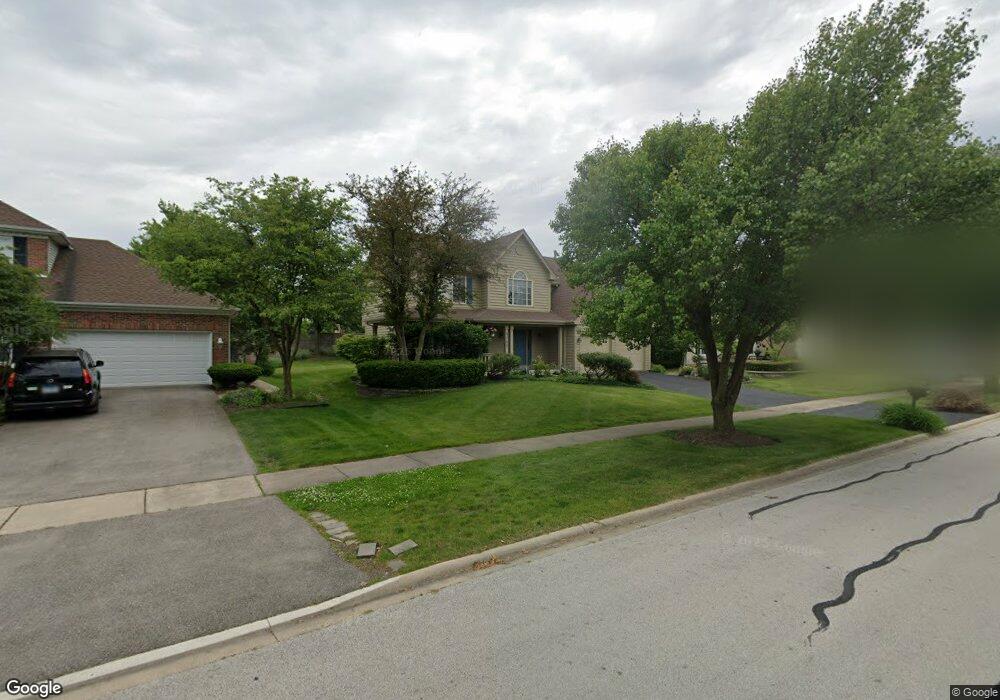
4768 Snapjack Cir Naperville, IL 60564
Saddle Creek NeighborhoodEstimated Value: $645,000 - $667,049
Studio
1
Bath
2,764
Sq Ft
$236/Sq Ft
Est. Value
About This Home
This home is located at 4768 Snapjack Cir, Naperville, IL 60564 and is currently estimated at $652,762, approximately $236 per square foot. 4768 Snapjack Cir is a home located in Will County with nearby schools including Oliver Julian Kendall Elementary School, Clifford Crone Middle School, and Neuqua Valley High School.
Ownership History
Date
Name
Owned For
Owner Type
Purchase Details
Closed on
May 29, 1997
Sold by
Aldridge Construction Company
Bought by
Lin Shi Wan and Cai Jing
Current Estimated Value
Home Financials for this Owner
Home Financials are based on the most recent Mortgage that was taken out on this home.
Original Mortgage
$211,500
Interest Rate
8.17%
Mortgage Type
Balloon
Purchase Details
Closed on
May 2, 1997
Sold by
Aldridge Frank M
Bought by
Aldridge Construction Company
Home Financials for this Owner
Home Financials are based on the most recent Mortgage that was taken out on this home.
Original Mortgage
$211,500
Interest Rate
8.17%
Mortgage Type
Balloon
Purchase Details
Closed on
Oct 25, 1995
Sold by
Aldridge Construction Company
Bought by
Aldridge Frank M
Purchase Details
Closed on
Mar 7, 1995
Sold by
First Colonial Trust Company
Bought by
Aldridge Construction Company
Create a Home Valuation Report for This Property
The Home Valuation Report is an in-depth analysis detailing your home's value as well as a comparison with similar homes in the area
Home Values in the Area
Average Home Value in this Area
Purchase History
| Date | Buyer | Sale Price | Title Company |
|---|---|---|---|
| Lin Shi Wan | $235,000 | Chicago Title Insurance Co | |
| Aldridge Construction Company | -- | -- | |
| Aldridge Frank M | -- | -- | |
| Aldridge Construction Company | $52,000 | Chicago Title Insurance Co |
Source: Public Records
Mortgage History
| Date | Status | Borrower | Loan Amount |
|---|---|---|---|
| Closed | Lin Shi Wan | $211,500 |
Source: Public Records
Tax History
| Year | Tax Paid | Tax Assessment Tax Assessment Total Assessment is a certain percentage of the fair market value that is determined by local assessors to be the total taxable value of land and additions on the property. | Land | Improvement |
|---|---|---|---|---|
| 2024 | $12,485 | $198,612 | $44,186 | $154,426 |
| 2023 | $12,485 | $175,453 | $39,034 | $136,419 |
| 2022 | $10,688 | $153,523 | $36,925 | $116,598 |
| 2021 | $10,213 | $146,213 | $35,167 | $111,046 |
| 2020 | $10,018 | $143,896 | $34,610 | $109,286 |
| 2019 | $9,845 | $139,841 | $33,635 | $106,206 |
| 2018 | $9,655 | $134,891 | $32,895 | $101,996 |
| 2017 | $10,115 | $139,443 | $32,046 | $107,397 |
| 2016 | $10,095 | $136,441 | $31,356 | $105,085 |
| 2015 | $9,590 | $131,193 | $30,150 | $101,043 |
| 2014 | $9,590 | $122,582 | $30,150 | $92,432 |
| 2013 | $9,590 | $122,582 | $30,150 | $92,432 |
Source: Public Records
Map
Nearby Homes
- 4711 Snapjack Cir
- 4507 Barr Creek Ln
- 2703 Wait Rd Unit 3
- 2836 Fairhauser Ct
- 5719 Rosinweed Ln
- 2255 Wendt Cir
- 2419 Lawlor Ln
- 2519 Mallet Ct
- 2423 Lawlor Ln
- 2515 Mallet Ct
- 2427 Lawlor Ln
- 2543 Mallet Ct
- 2316 Spur Rd
- 2547 Mallet Ct
- 5904 Hawkweed Dr Unit 7402
- 5902 Hawkweed Dr Unit 7401
- 12021 S Stallion Dr
- 23234 W Allagash Dr
- 2607 Lawlor Ln
- 2611 Lawlor Ln
- 4764 Snapjack Cir
- 4772 Snapjack Cir
- 4776 Snapjack Cir
- 4760 Snapjack Cir
- 4747 Snapjack Cir
- 4780 Snapjack Cir
- 4771 Snapjack Cir
- 4756 Snapjack Cir
- 4775 Snapjack Cir
- 2135 Yellowstar Ln
- 2139 Yellowstar Ln
- 4743 Snapjack Cir
- 4752 Snapjack Cir
- 2131 Yellowstar Ln
- 2143 Yellowstar Ln
- 4784 Snapjack Cir
- 4779 Snapjack Cir
- 4748 Snapjack Cir
- 2127 Yellowstar Ln
- 4739 Snapjack Cir Unit 1
Your Personal Tour Guide
Ask me questions while you tour the home.