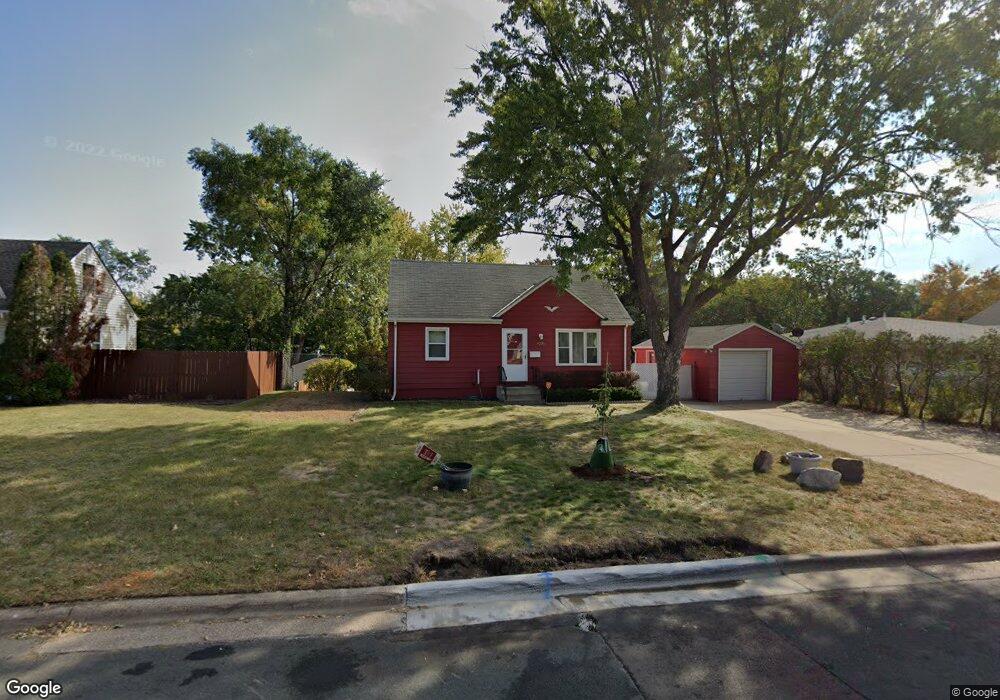
4769 2 1/2 St NE Minneapolis, MN 55421
Estimated Value: $338,409 - $379,000
3
Beds
3
Baths
1,164
Sq Ft
$302/Sq Ft
Est. Value
About This Home
This home is located at 4769 2 1/2 St NE, Minneapolis, MN 55421 and is currently estimated at $352,102, approximately $302 per square foot. 4769 2 1/2 St NE is a home located in Anoka County with nearby schools including North Park Elementary School, Prodeo Academy, and Immaculate Conception Catholic School.
Ownership History
Date
Name
Owned For
Owner Type
Purchase Details
Closed on
Oct 9, 2024
Sold by
Hood Destine
Bought by
Sumba Chimborazo Diego and Tacuri Guayllas Erika
Current Estimated Value
Home Financials for this Owner
Home Financials are based on the most recent Mortgage that was taken out on this home.
Original Mortgage
$276,000
Outstanding Balance
$273,098
Interest Rate
6.35%
Mortgage Type
New Conventional
Estimated Equity
$79,004
Purchase Details
Closed on
Aug 29, 2019
Sold by
Halsey Scott C and Halsey Kelly K
Bought by
Hood Destine Rose
Home Financials for this Owner
Home Financials are based on the most recent Mortgage that was taken out on this home.
Original Mortgage
$245,160
Interest Rate
3.7%
Mortgage Type
VA
Purchase Details
Closed on
Mar 26, 1997
Sold by
Novak Joseph V and Novak Donna Mae
Bought by
Halsey Scott C and Halsey Kelly K
Create a Home Valuation Report for This Property
The Home Valuation Report is an in-depth analysis detailing your home's value as well as a comparison with similar homes in the area
Home Values in the Area
Average Home Value in this Area
Purchase History
| Date | Buyer | Sale Price | Title Company |
|---|---|---|---|
| Sumba Chimborazo Diego | $345,000 | -- | |
| Hood Destine Rose | $240,000 | Trademark Title Services Inc | |
| Halsey Scott C | $92,500 | -- |
Source: Public Records
Mortgage History
| Date | Status | Borrower | Loan Amount |
|---|---|---|---|
| Open | Sumba Chimborazo Diego | $276,000 | |
| Previous Owner | Hood Destine Rose | $245,160 |
Source: Public Records
Tax History Compared to Growth
Tax History
| Year | Tax Paid | Tax Assessment Tax Assessment Total Assessment is a certain percentage of the fair market value that is determined by local assessors to be the total taxable value of land and additions on the property. | Land | Improvement |
|---|---|---|---|---|
| 2025 | $3,213 | $291,300 | $87,600 | $203,700 |
| 2024 | $3,213 | $286,000 | $79,500 | $206,500 |
| 2023 | $3,053 | $288,700 | $69,700 | $219,000 |
| 2022 | $2,577 | $285,200 | $67,000 | $218,200 |
| 2021 | $2,757 | $233,100 | $60,400 | $172,700 |
| 2020 | $2,525 | $233,300 | $58,400 | $174,900 |
| 2019 | $2,344 | $219,600 | $52,700 | $166,900 |
| 2018 | $1,970 | $202,300 | $0 | $0 |
| 2017 | $1,812 | $164,000 | $0 | $0 |
| 2016 | $1,678 | $141,100 | $0 | $0 |
| 2015 | $1,706 | $141,100 | $38,400 | $102,700 |
| 2014 | -- | $124,000 | $33,500 | $90,500 |
Source: Public Records
Map
Nearby Homes
- 4532 2nd St NE
- 4928 4th St NE
- 4849 5th St NE
- 4717 6th St NE
- 4507 5th St NE
- 5006 6th St NE
- 4408 2nd St NE
- 4438 6th St NE
- 4559 Washington St NE
- 5000 Washington St NE
- 625 47th Ave NE
- 4316 4th St NE
- 685 49th Ave NE
- 5207 7th St NE
- 719 49th Ave NE
- 4228 5th St NE
- 613 Sullivan Dr NE
- 4213 Main St NE
- 4415 Madison St NE
- 4304 Jefferson St NE
- 4757 2 1/2 St NE
- 4781 2 1/2 St NE
- 4781 2 1 2 St NE
- 4757 2 1 2 St NE
- 4757 2 1/2 St NE
- 4733 2 1/2 St NE
- 4733 2 1 2 St NE
- 4762 2 1/2 St NE
- 4768 3rd St NE
- 4762 2 1 2 St NE
- 4780 2 1/2 St NE
- 4780 2 1 2 St NE
- 4756 3rd St NE
- 4780 3rd St NE
- 4756 2 1/2 St NE
- 4803 2 1/2 St NE
- 4725 4725 2 1 2-Street-ne
- 4725 2 1/2 St NE
- 4744 2 1/2 St NE
- 4744 2 1 2 St NE