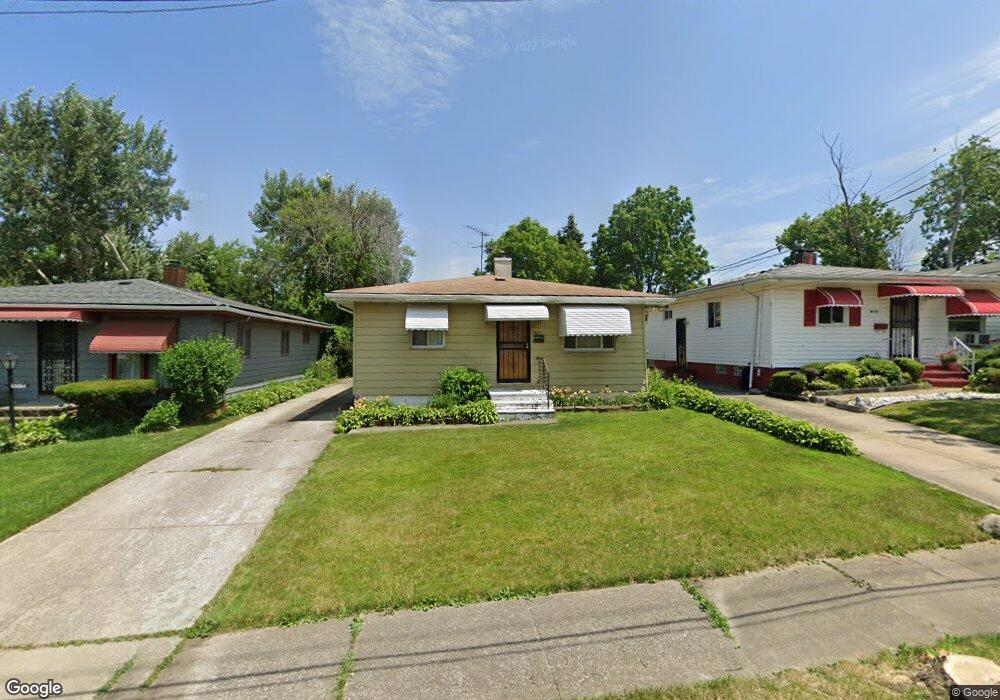
4769 E 174th St Cleveland, OH 44128
Lee-Miles NeighborhoodEstimated Value: $74,000 - $105,000
3
Beds
1
Bath
972
Sq Ft
$86/Sq Ft
Est. Value
About This Home
This home is located at 4769 E 174th St, Cleveland, OH 44128 and is currently estimated at $83,813, approximately $86 per square foot. 4769 E 174th St is a home located in Cuyahoga County with nearby schools including Adlai Stevenson School, Andrew J. Rickoff School, and Anton Grdina School.
Ownership History
Date
Name
Owned For
Owner Type
Purchase Details
Closed on
Jan 22, 2025
Sold by
Warner Antwan
Bought by
Ambrose Jake
Current Estimated Value
Purchase Details
Closed on
Apr 20, 2023
Sold by
Ward Bernice E
Bought by
Warner Antwan
Purchase Details
Closed on
Jan 31, 2005
Sold by
Ward James
Bought by
Wingate Bernice E
Purchase Details
Closed on
Nov 24, 2001
Sold by
Wingate Bernice E
Bought by
Ward James
Purchase Details
Closed on
Mar 12, 2001
Sold by
Green Cheryl D and Green Cynthy D
Bought by
Wingate Bernice E
Home Financials for this Owner
Home Financials are based on the most recent Mortgage that was taken out on this home.
Original Mortgage
$71,379
Interest Rate
7.13%
Mortgage Type
FHA
Purchase Details
Closed on
Sep 21, 1999
Sold by
Estate Of Evelyn J Green
Bought by
Green Cheryl D and Green Cynthy D
Purchase Details
Closed on
Jul 1, 1976
Sold by
Green Carl and Green Evelyn J
Bought by
Green Evelyn J
Purchase Details
Closed on
Jan 1, 1975
Bought by
Green Carl and Green Evelyn J
Create a Home Valuation Report for This Property
The Home Valuation Report is an in-depth analysis detailing your home's value as well as a comparison with similar homes in the area
Home Values in the Area
Average Home Value in this Area
Purchase History
| Date | Buyer | Sale Price | Title Company |
|---|---|---|---|
| Ambrose Jake | $70,400 | Chicago Title | |
| Warner Antwan | $37,100 | None Listed On Document | |
| Wingate Bernice E | -- | -- | |
| Ward James | -- | -- | |
| Wingate Bernice E | $72,500 | Hometown Usa Title Agency | |
| Green Cheryl D | -- | -- | |
| Green Evelyn J | -- | -- | |
| Green Carl | -- | -- |
Source: Public Records
Mortgage History
| Date | Status | Borrower | Loan Amount |
|---|---|---|---|
| Previous Owner | Wingate Bernice E | $71,379 |
Source: Public Records
Tax History Compared to Growth
Tax History
| Year | Tax Paid | Tax Assessment Tax Assessment Total Assessment is a certain percentage of the fair market value that is determined by local assessors to be the total taxable value of land and additions on the property. | Land | Improvement |
|---|---|---|---|---|
| 2024 | $1,444 | $21,595 | $4,900 | $16,695 |
| 2023 | $1,007 | $12,990 | $3,500 | $9,490 |
| 2022 | $320 | $12,985 | $3,500 | $9,485 |
| 2021 | $317 | $12,990 | $3,500 | $9,490 |
| 2020 | $275 | $11,940 | $3,220 | $8,720 |
| 2019 | $255 | $34,100 | $9,200 | $24,900 |
| 2018 | $127 | $11,940 | $3,220 | $8,720 |
| 2017 | $402 | $13,620 | $3,080 | $10,540 |
| 2016 | $398 | $13,620 | $3,080 | $10,540 |
| 2015 | $523 | $13,620 | $3,080 | $10,540 |
| 2014 | $523 | $15,120 | $3,430 | $11,690 |
Source: Public Records
Map
Nearby Homes
- 4761 E 173rd St
- 17616 Tarkington Ave
- 17806 Tarkington Ave
- 4616 E 174th St
- 17714 S Miles Rd
- 16702 Tarkington Ave
- 16817 Glenpark Ave
- 16613 Glenpark Ave
- 16712 Kollin Ave
- 17005 Lipton Ave
- 5031 Cato St
- 16813 Lipton Ave
- 16312 Sunny Glenn Ave
- 16401 Clearview Ave
- 5061 Philip Ave
- 16317 Clearview Ave
- 16216 Sunny Glenn Ave
- 5082 Philip Ave
- 16309 Bryce Ave
- 5110 Philip Ave
- 4765 E 174th St
- 4773 E 174th St
- 4761 E 174th St
- 4777 E 174th St
- 4781 E 174th St
- 4757 E 174th St
- 4766 E 175th St
- 4770 E 175th St
- 4762 E 175th St
- 4758 E 175th St
- 4774 E 175th St
- 4753 E 174th St
- 4785 E 174th St
- 4768 E 174th St
- 4772 E 174th St
- 4764 E 174th St
- 4754 E 175th St
- 4776 E 175th St
- 4776 E 174th St
- 4760 E 174th St