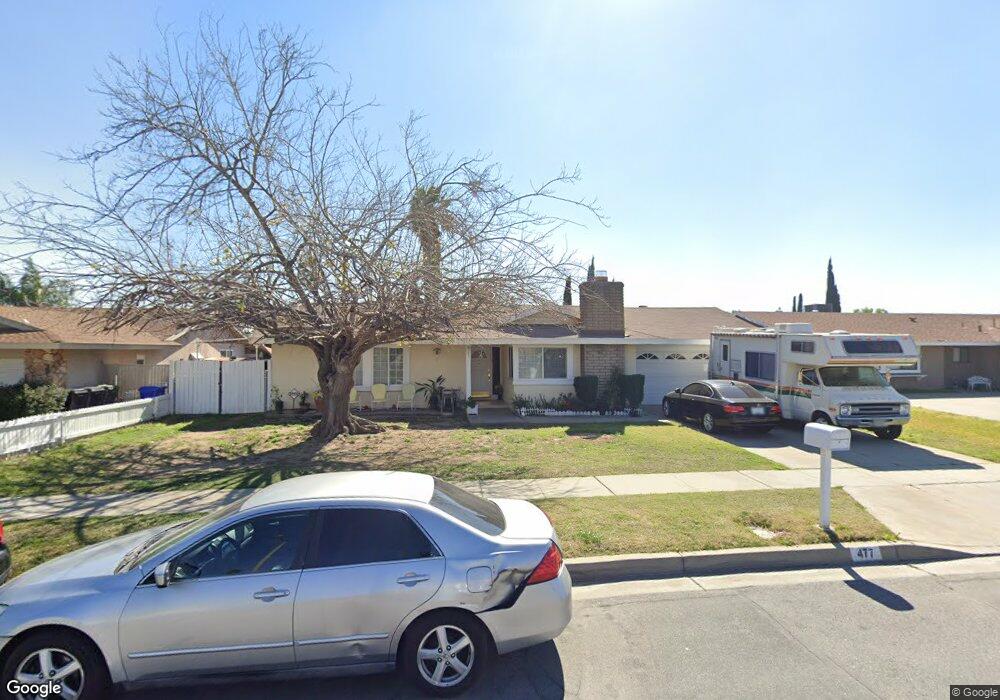
477 E Scott St Rialto, CA 92376
Estimated Value: $547,300 - $587,000
4
Beds
2
Baths
1,442
Sq Ft
$389/Sq Ft
Est. Value
About This Home
This home is located at 477 E Scott St, Rialto, CA 92376 and is currently estimated at $561,325, approximately $389 per square foot. 477 E Scott St is a home located in San Bernardino County with nearby schools including Morgan Elementary School, Frisbie Middle School, and Eisenhower High School.
Ownership History
Date
Name
Owned For
Owner Type
Purchase Details
Closed on
Oct 22, 2002
Sold by
Jardine Naranjo Victoria L
Bought by
Naranjo David
Current Estimated Value
Home Financials for this Owner
Home Financials are based on the most recent Mortgage that was taken out on this home.
Original Mortgage
$28,000
Outstanding Balance
$11,593
Interest Rate
5.99%
Mortgage Type
Purchase Money Mortgage
Estimated Equity
$549,732
Purchase Details
Closed on
Sep 16, 2002
Sold by
Rasmussen Stanley Robert and Rasmussen Sara Michelle
Bought by
Naranjo David
Home Financials for this Owner
Home Financials are based on the most recent Mortgage that was taken out on this home.
Original Mortgage
$28,000
Outstanding Balance
$11,593
Interest Rate
5.99%
Mortgage Type
Purchase Money Mortgage
Estimated Equity
$549,732
Purchase Details
Closed on
Oct 25, 1995
Sold by
Blandford Thomas W
Bought by
Rasmussen Stanley Robert and Rasmussen Sara Michelle
Create a Home Valuation Report for This Property
The Home Valuation Report is an in-depth analysis detailing your home's value as well as a comparison with similar homes in the area
Home Values in the Area
Average Home Value in this Area
Purchase History
| Date | Buyer | Sale Price | Title Company |
|---|---|---|---|
| Naranjo David | -- | Orange Coast Title | |
| Naranjo David | $140,000 | Orange Coast Title | |
| Rasmussen Stanley Robert | -- | -- |
Source: Public Records
Mortgage History
| Date | Status | Borrower | Loan Amount |
|---|---|---|---|
| Open | Naranjo David | $28,000 | |
| Previous Owner | Naranjo David | $112,000 |
Source: Public Records
Tax History
| Year | Tax Paid | Tax Assessment Tax Assessment Total Assessment is a certain percentage of the fair market value that is determined by local assessors to be the total taxable value of land and additions on the property. | Land | Improvement |
|---|---|---|---|---|
| 2025 | $3,233 | $231,735 | $57,934 | $173,801 |
| 2024 | $3,110 | $227,191 | $56,798 | $170,393 |
| 2023 | $4,094 | $222,736 | $55,684 | $167,052 |
| 2022 | $3,849 | $218,368 | $54,592 | $163,776 |
| 2021 | $3,898 | $214,087 | $53,522 | $160,565 |
| 2020 | $3,923 | $211,892 | $52,973 | $158,919 |
| 2019 | $3,845 | $207,737 | $51,934 | $155,803 |
| 2018 | $3,456 | $203,664 | $50,916 | $152,748 |
| 2017 | $2,848 | $199,671 | $49,918 | $149,753 |
| 2016 | $3,036 | $195,756 | $48,939 | $146,817 |
| 2015 | $3,243 | $192,816 | $48,204 | $144,612 |
| 2014 | $2,758 | $189,039 | $47,260 | $141,779 |
Source: Public Records
Map
Nearby Homes
- 251 E Scott St
- 1431 N Eucalyptus Ave
- 1335 N Magnolia Ave
- 822 E Virginia St
- 160 W Cascade Dr
- 1423 Terrace Rd
- 178 W Walnut Ave Unit D
- 723 E Shamrock St
- 0 N Acacia Ave Unit CV25094258
- 932 N Encina Ave
- 917 E Jackson St
- 866 N Eucalyptus Ave
- 2158 N Magnolia Ave
- 1560 N Vista Ave
- 1839 N Millard Ave
- 461 W Scott St
- 979 N Gardena Ave
- 470 W Jackson St
- 554 W Mariposa Dr
- 133 E Van Koevering St
- 465 E Scott St
- 489 E Scott St
- 1495 N Joyce Ave
- 1498 N Acacia Ave
- 1488 N Acacia Ave
- 453 E Scott St
- 478 E Scott St
- 1483 N Joyce Ave
- 492 E Scott St
- 1486 N Acacia Ave
- 464 E Scott St
- 1496 N Joyce Ave
- 511 E Scott St
- 441 E Scott St
- 450 E Scott St
- 471 E Cerritos St
- 1471 N Joyce Ave
- 1484 N Joyce Ave
- 483 E Cerritos St
- 1474 N Acacia Ave
Your Personal Tour Guide
Ask me questions while you tour the home.