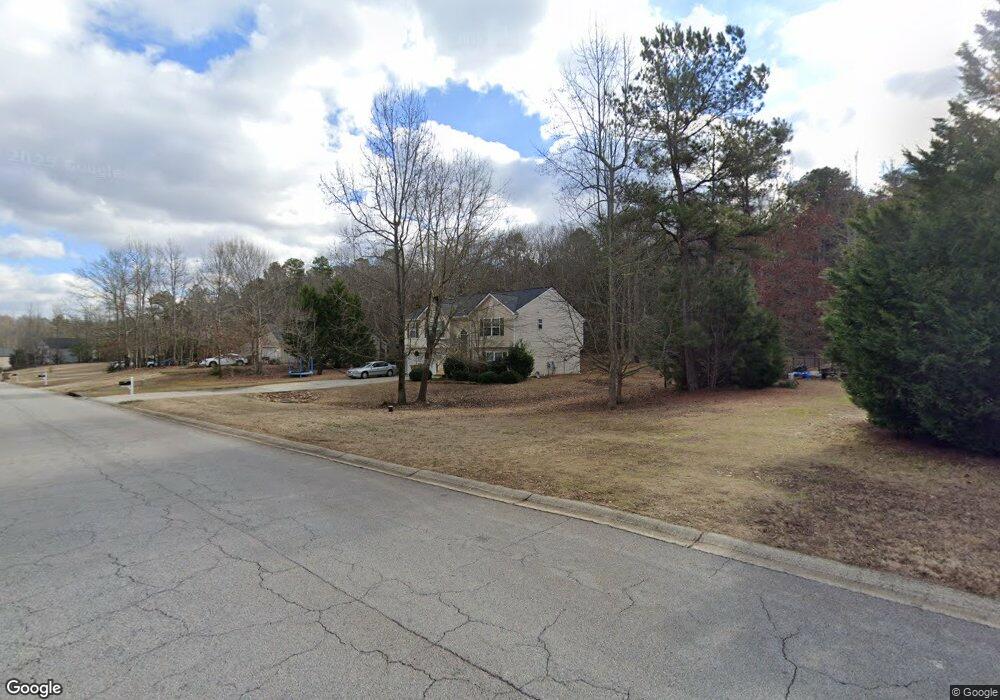
477 Gin Mill Dr Monroe, GA 30656
Estimated Value: $318,000 - $340,000
4
Beds
3
Baths
1,859
Sq Ft
$176/Sq Ft
Est. Value
About This Home
This home is located at 477 Gin Mill Dr, Monroe, GA 30656 and is currently estimated at $326,925, approximately $175 per square foot. 477 Gin Mill Dr is a home located in Barrow County with nearby schools including Bethlehem Elementary School, Haymon-Morris Middle School, and Apalachee High School.
Ownership History
Date
Name
Owned For
Owner Type
Purchase Details
Closed on
May 30, 2012
Sold by
Federal Home Loan Mortgage Corporation
Bought by
Bowman Ytandra
Current Estimated Value
Home Financials for this Owner
Home Financials are based on the most recent Mortgage that was taken out on this home.
Original Mortgage
$69,897
Outstanding Balance
$47,946
Interest Rate
3.84%
Mortgage Type
New Conventional
Estimated Equity
$278,979
Purchase Details
Closed on
Mar 1, 2011
Sold by
Jimenez Celia A
Bought by
Bac Home Loans Servicing Lp
Purchase Details
Closed on
Dec 29, 2005
Sold by
Biltmore Construction Co Inc
Bought by
Jimenez Celia A
Home Financials for this Owner
Home Financials are based on the most recent Mortgage that was taken out on this home.
Original Mortgage
$146,900
Interest Rate
6.28%
Mortgage Type
New Conventional
Purchase Details
Closed on
Feb 2, 2004
Sold by
Millstone Development Group In
Bought by
Biltmore Construction Company Inc
Purchase Details
Closed on
Feb 28, 2002
Bought by
Millstone Development Group Inc
Create a Home Valuation Report for This Property
The Home Valuation Report is an in-depth analysis detailing your home's value as well as a comparison with similar homes in the area
Home Values in the Area
Average Home Value in this Area
Purchase History
| Date | Buyer | Sale Price | Title Company |
|---|---|---|---|
| Bowman Ytandra | $64,900 | -- | |
| Bac Home Loans Servicing Lp | -- | -- | |
| Jimenez Celia A | $146,900 | -- | |
| Biltmore Construction Company Inc | $34,500 | -- | |
| Millstone Development Group Inc | -- | -- |
Source: Public Records
Mortgage History
| Date | Status | Borrower | Loan Amount |
|---|---|---|---|
| Open | Bowman Ytandra | $69,897 | |
| Previous Owner | Jimenez Celia A | $146,900 |
Source: Public Records
Tax History
| Year | Tax Paid | Tax Assessment Tax Assessment Total Assessment is a certain percentage of the fair market value that is determined by local assessors to be the total taxable value of land and additions on the property. | Land | Improvement |
|---|---|---|---|---|
| 2025 | $2,752 | $114,094 | $23,200 | $90,894 |
| 2024 | $2,789 | $111,483 | $23,200 | $88,283 |
| 2023 | $2,775 | $111,483 | $23,200 | $88,283 |
| 2022 | $2,753 | $95,082 | $19,600 | $75,482 |
| 2021 | $2,338 | $75,830 | $14,000 | $61,830 |
| 2020 | $2,272 | $73,430 | $11,600 | $61,830 |
| 2019 | $2,174 | $68,880 | $11,600 | $57,280 |
| 2018 | $2,013 | $64,330 | $11,600 | $52,730 |
| 2017 | $1,462 | $50,200 | $9,600 | $40,600 |
| 2016 | $1,375 | $43,577 | $9,600 | $33,977 |
| 2015 | $1,393 | $43,946 | $9,600 | $34,346 |
| 2014 | $1,365 | $41,575 | $6,860 | $34,715 |
| 2013 | -- | $39,361 | $6,860 | $32,501 |
Source: Public Records
Map
Nearby Homes
- 463 Gin Mill Dr
- 465 Cade Ct
- 1224 Dale Dr
- 590 Manning Gin Rd
- 439 Vinings Ct
- 1101 Kailie Dr
- 1210 Austin Rd
- 864 Ode Peppers Ct
- 884 Jackson Trail Rd
- 3207 Jack Glass Rd
- 269 Knightsbridge Ln
- 259 Dunagan Ct
- 222 Knightsbridge Ln
- 698 Smith Cemetery Rd
- 136 Bristol Blvd
- LOT 3 Manning Gin Rd
- LOT 1 Manning Gin Rd
- LOT 2 Manning Gin Rd
- LOT 4 Manning Gin Rd
- LOT 5 Manning Gin Rd
- 479 Gin Mill Dr
- 475 Gin Mill Dr
- 481 Gin Mill Dr
- 473 Gin Mill Dr
- 1401 Gin Mill Ct
- 483 Gin Mill Dr
- 480 Manning Gin Rd
- 480 Manning Gin Rd Unit 7
- 480 Manning Gin Rd Unit 30
- 1400 Gin Mill Ct
- 471 Gin Mill Dr
- 480 Gin Mill Dr
- 485 Gin Mill Dr
- 1405 Gin Mill Ct
- 469 Gin Mill Dr
- 484 Gin Mill Dr
- 472 Gin Mill Dr
- 1402 Gin Mill Ct
- 487 Gin Mill Dr
- 470 Gin Mill Dr Unit 21
Your Personal Tour Guide
Ask me questions while you tour the home.