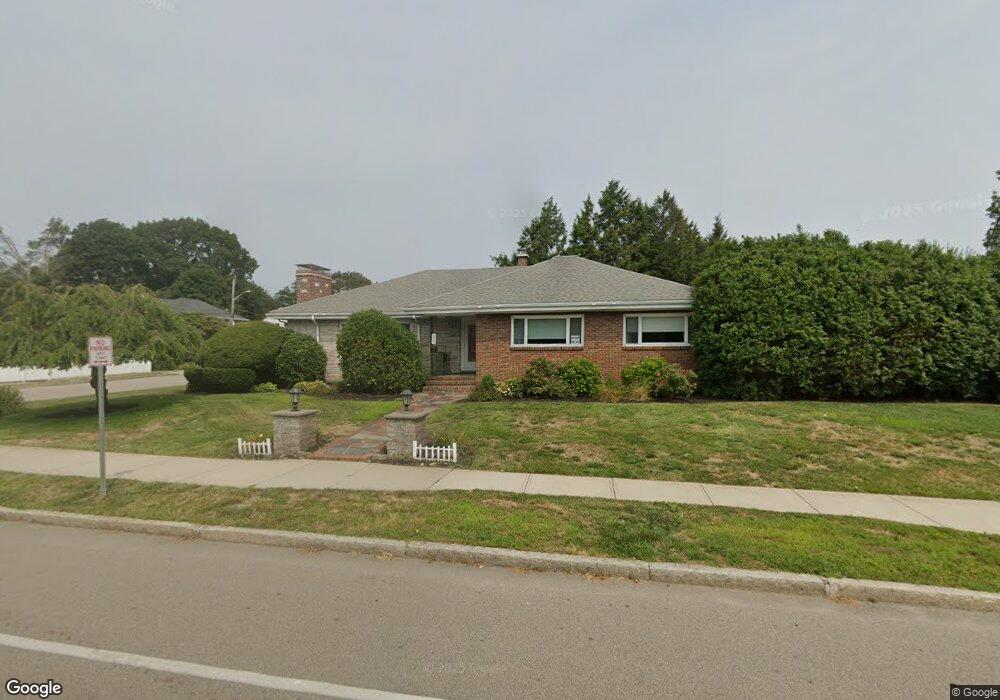
477 W Elm St Brockton, MA 02301
Estimated Value: $568,000 - $704,000
3
Beds
2
Baths
2,228
Sq Ft
$289/Sq Ft
Est. Value
About This Home
This home is located at 477 W Elm St, Brockton, MA 02301 and is currently estimated at $644,695, approximately $289 per square foot. 477 W Elm St is a home located in Plymouth County with nearby schools including Manthala George Jr. School, Louis F Angelo Elementary School, and Hancock Elementary School.
Ownership History
Date
Name
Owned For
Owner Type
Purchase Details
Closed on
Oct 30, 2012
Sold by
Garcea Francis D and Garcea Jon W
Bought by
Garcea Jon W
Current Estimated Value
Purchase Details
Closed on
Jun 4, 2007
Sold by
Kerrigan Leanne H and Hoy Eugene M
Bought by
Garcea Francis D and Garcea Jon W
Home Financials for this Owner
Home Financials are based on the most recent Mortgage that was taken out on this home.
Original Mortgage
$300,000
Interest Rate
6.24%
Mortgage Type
Purchase Money Mortgage
Purchase Details
Closed on
Feb 25, 2005
Sold by
Hoy Geraldine M
Bought by
Hoy Eugene M and Kerrigan Leanne H
Purchase Details
Closed on
Jun 4, 1998
Sold by
Alfonso Joanne
Bought by
Hoy Richard and Hoy Geraldine M
Create a Home Valuation Report for This Property
The Home Valuation Report is an in-depth analysis detailing your home's value as well as a comparison with similar homes in the area
Home Values in the Area
Average Home Value in this Area
Purchase History
| Date | Buyer | Sale Price | Title Company |
|---|---|---|---|
| Garcea Jon W | -- | -- | |
| Garcea Francis D | $380,000 | -- | |
| Hoy Eugene M | -- | -- | |
| Hoy Richard | $175,000 | -- |
Source: Public Records
Mortgage History
| Date | Status | Borrower | Loan Amount |
|---|---|---|---|
| Previous Owner | Hoy Richard | $300,000 | |
| Previous Owner | Hoy Richard | $35,000 |
Source: Public Records
Tax History Compared to Growth
Tax History
| Year | Tax Paid | Tax Assessment Tax Assessment Total Assessment is a certain percentage of the fair market value that is determined by local assessors to be the total taxable value of land and additions on the property. | Land | Improvement |
|---|---|---|---|---|
| 2025 | $7,334 | $605,600 | $153,300 | $452,300 |
| 2024 | $7,242 | $602,500 | $153,300 | $449,200 |
| 2023 | $6,861 | $528,600 | $118,800 | $409,800 |
| 2022 | $6,936 | $496,500 | $108,300 | $388,200 |
| 2021 | $6,435 | $443,800 | $100,200 | $343,600 |
| 2020 | $8,983 | $431,100 | $96,000 | $335,100 |
| 2019 | $8,637 | $396,200 | $89,800 | $306,400 |
| 2018 | $7,934 | $381,300 | $89,800 | $291,500 |
| 2017 | $5,777 | $358,800 | $89,800 | $269,000 |
| 2016 | $6,484 | $373,500 | $86,000 | $287,500 |
| 2015 | $6,402 | $352,700 | $86,000 | $266,700 |
| 2014 | $6,275 | $346,100 | $86,000 | $260,100 |
Source: Public Records
Map
Nearby Homes