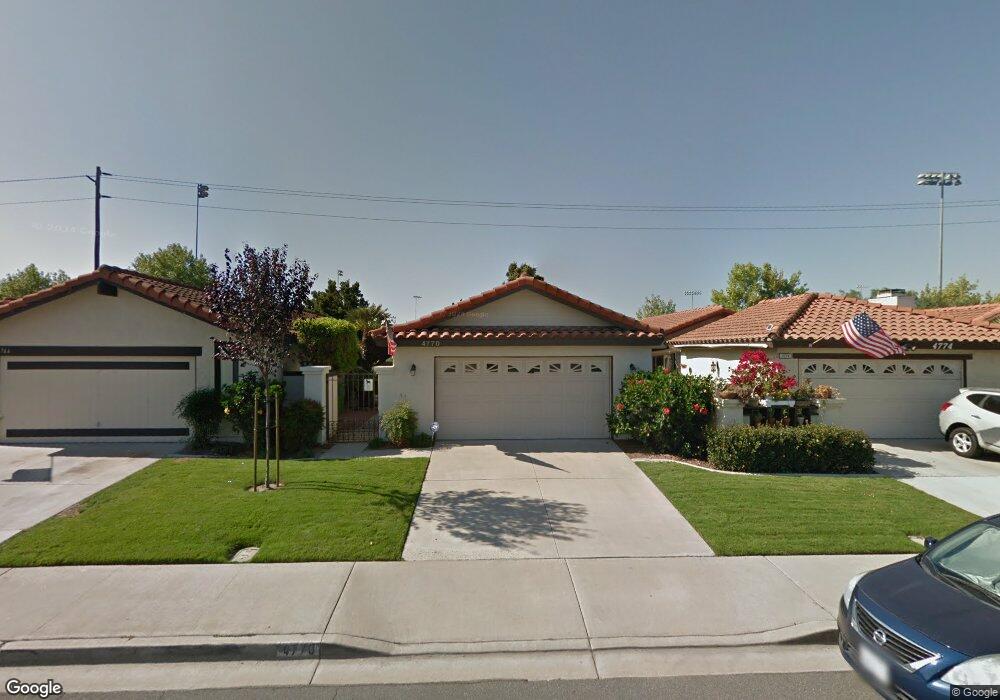
4770 Gardenia St Oceanside, CA 92057
San Luis Rey NeighborhoodEstimated Value: $636,224 - $707,000
2
Beds
2
Baths
906
Sq Ft
$752/Sq Ft
Est. Value
About This Home
This home is located at 4770 Gardenia St, Oceanside, CA 92057 and is currently estimated at $681,306, approximately $751 per square foot. 4770 Gardenia St is a home located in San Diego County with nearby schools including Del Rio Elementary School, Cesar Chavez Middle School, and El Camino High School.
Ownership History
Date
Name
Owned For
Owner Type
Purchase Details
Closed on
Oct 31, 2018
Sold by
Yeomans Rebecca Cay
Bought by
Yeomans Rebecca C and The Rebecca C Yeomans October
Current Estimated Value
Purchase Details
Closed on
Jun 12, 2012
Sold by
Yeomans Rebecca Cay
Bought by
Yeomans Ralph L and Yeomans Rebecca Cay
Purchase Details
Closed on
Nov 15, 2011
Sold by
Yeomans Rebecca Cay and Cherry Rebecca C
Bought by
Yeomans Rebecca Cay
Home Financials for this Owner
Home Financials are based on the most recent Mortgage that was taken out on this home.
Original Mortgage
$146,250
Outstanding Balance
$100,065
Interest Rate
4.09%
Mortgage Type
New Conventional
Estimated Equity
$581,241
Purchase Details
Closed on
May 24, 2001
Sold by
Cherry Rebecca C
Bought by
Cherry Rebecca C
Home Financials for this Owner
Home Financials are based on the most recent Mortgage that was taken out on this home.
Original Mortgage
$121,000
Interest Rate
7.14%
Purchase Details
Closed on
Nov 27, 1990
Purchase Details
Closed on
Aug 5, 1985
Create a Home Valuation Report for This Property
The Home Valuation Report is an in-depth analysis detailing your home's value as well as a comparison with similar homes in the area
Home Values in the Area
Average Home Value in this Area
Purchase History
| Date | Buyer | Sale Price | Title Company |
|---|---|---|---|
| Yeomans Rebecca C | -- | None Available | |
| Yeomans Ralph L | -- | None Available | |
| Yeomans Rebecca Cay | -- | Usa National Title Company | |
| Yeomans Rebecca Cay | -- | Usa National Title Company | |
| Cherry Rebecca C | -- | Southland Title Corporation | |
| -- | $136,500 | -- | |
| -- | $74,300 | -- |
Source: Public Records
Mortgage History
| Date | Status | Borrower | Loan Amount |
|---|---|---|---|
| Open | Yeomans Rebecca Cay | $146,250 | |
| Closed | Yeomans Rebecca Cay | $146,250 | |
| Closed | Cherry Rebecca C | $121,000 |
Source: Public Records
Tax History Compared to Growth
Tax History
| Year | Tax Paid | Tax Assessment Tax Assessment Total Assessment is a certain percentage of the fair market value that is determined by local assessors to be the total taxable value of land and additions on the property. | Land | Improvement |
|---|---|---|---|---|
| 2025 | $2,750 | $246,169 | $70,402 | $175,767 |
| 2024 | $2,750 | $241,343 | $69,022 | $172,321 |
| 2023 | $2,665 | $236,612 | $67,669 | $168,943 |
| 2022 | $2,625 | $231,974 | $66,343 | $165,631 |
| 2021 | $2,635 | $227,427 | $65,043 | $162,384 |
| 2020 | $2,554 | $225,096 | $64,377 | $160,719 |
| 2019 | $2,481 | $220,683 | $63,115 | $157,568 |
| 2018 | $2,455 | $216,357 | $61,878 | $154,479 |
| 2017 | $2,410 | $212,115 | $60,665 | $151,450 |
| 2016 | $2,332 | $207,957 | $59,476 | $148,481 |
| 2015 | $2,265 | $204,834 | $58,583 | $146,251 |
| 2014 | $2,179 | $200,823 | $57,436 | $143,387 |
Source: Public Records
Map
Nearby Homes
- 4773 Sequoia Place
- 4819 Gardenia St
- 267 Oleander Dr
- 4843 Sagina Ct Unit 6
- 4791 Macadamia Ct
- 207 Carissa Dr
- 4827 Luna Dr
- 4816 Siesta Dr
- 166 Harrison St
- 790 Mosaic Cir
- 852 Essence Ave
- 5202 Via Tizon
- 838 Mosaic Cir
- 314 La Soledad Way
- 339 La Purisma Way
- 328 Liberty Way
- 343 La Purisma Way
- 0 N River Rd Unit NDP2507519
- 4660 N River Rd Unit 17
- 4660 N River Rd Unit 150
- 4766 Gardenia St
- 4774 Gardenia St Unit 4
- 4762 Gardenia St
- 4778 Gardenia St
- 4758 Gardenia St
- 4782 Gardenia St
- 4754 Gardenia St
- 4786 Gardenia St
- 4767 Gardenia St
- 4771 Gardenia St Unit 4
- 4763 Gardenia St
- 4775 Gardenia St
- 4759 Gardenia St
- 4750 Gardenia St
- 4790 Gardenia St
- 4779 Gardenia St
- 4755 Gardenia St
- 4783 Gardenia St
- 4794 Gardenia St
- 4751 Gardenia St