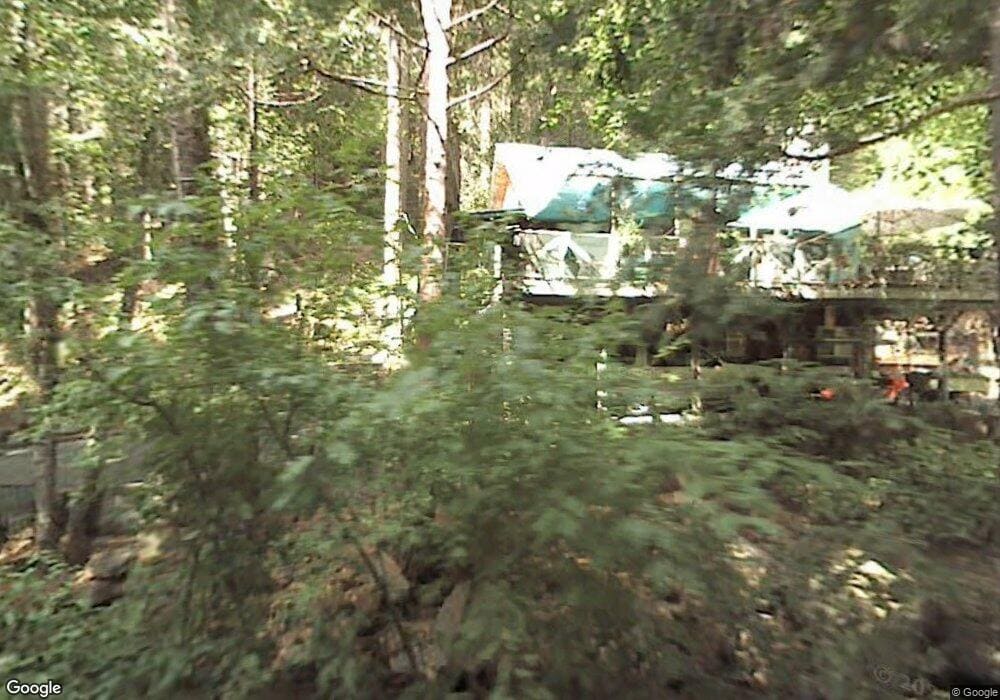
47726 Lewis Creek Rd Oakhurst, CA 93644
Estimated Value: $207,493 - $313,000
2
Beds
1
Bath
672
Sq Ft
$409/Sq Ft
Est. Value
About This Home
This home is located at 47726 Lewis Creek Rd, Oakhurst, CA 93644 and is currently estimated at $274,873, approximately $409 per square foot. 47726 Lewis Creek Rd is a home located in Madera County with nearby schools including Oakhurst Elementary School and Oak Creek Intermediate School.
Ownership History
Date
Name
Owned For
Owner Type
Purchase Details
Closed on
Jul 19, 2024
Sold by
Oliver Christine M
Bought by
Christine Oliver Irrevocable Grantor Trust and Oliver
Current Estimated Value
Purchase Details
Closed on
Jul 5, 2024
Sold by
John Stephen Copland Revocable Trust and Protzman Patricia M
Bought by
Copland-Protzman Patricia Marie and Checket Christina Copland
Purchase Details
Closed on
Dec 18, 2019
Sold by
Copland John Stephen
Bought by
Copland John Stephen
Purchase Details
Closed on
Apr 20, 2015
Sold by
Wade Monica J
Bought by
William P Wade & Monica J Wade Inter Viv
Purchase Details
Closed on
Apr 22, 2001
Sold by
Linehan Susan Tr and Copeland Juliette
Bought by
Copeland Juliette
Purchase Details
Closed on
Dec 7, 1999
Sold by
Linehan Susan
Bought by
Linehan Susan
Purchase Details
Closed on
Sep 27, 1999
Sold by
Linehan Susan S
Bought by
Linehan Susan S
Create a Home Valuation Report for This Property
The Home Valuation Report is an in-depth analysis detailing your home's value as well as a comparison with similar homes in the area
Home Values in the Area
Average Home Value in this Area
Purchase History
| Date | Buyer | Sale Price | Title Company |
|---|---|---|---|
| Christine Oliver Irrevocable Grantor Trust | -- | None Listed On Document | |
| Copland-Protzman Patricia Marie | -- | None Listed On Document | |
| Copland John Stephen | -- | None Available | |
| William P Wade & Monica J Wade Inter Viv | -- | None Available | |
| Copland John Stephen | -- | None Available | |
| Copeland Juliette | $50,000 | Chicago Title Co | |
| Linehan Susan | -- | -- | |
| Linehan Susan S | -- | -- |
Source: Public Records
Tax History Compared to Growth
Tax History
| Year | Tax Paid | Tax Assessment Tax Assessment Total Assessment is a certain percentage of the fair market value that is determined by local assessors to be the total taxable value of land and additions on the property. | Land | Improvement |
|---|---|---|---|---|
| 2025 | $759 | $73,838 | $44,305 | $29,533 |
| 2023 | $759 | $70,973 | $42,586 | $28,387 |
| 2022 | $737 | $69,582 | $41,751 | $27,831 |
| 2021 | $728 | $68,219 | $40,933 | $27,286 |
| 2020 | $724 | $67,521 | $40,514 | $27,007 |
| 2019 | $711 | $66,198 | $39,720 | $26,478 |
| 2018 | $694 | $64,901 | $38,942 | $25,959 |
| 2017 | $682 | $63,629 | $38,179 | $25,450 |
| 2016 | $660 | $62,382 | $37,431 | $24,951 |
| 2015 | $651 | $61,446 | $36,869 | $24,577 |
| 2014 | $641 | $60,243 | $36,147 | $24,096 |
Source: Public Records
Map
Nearby Homes
- 47824 Brammer Purl Rd
- 50054 Poplar Rd
- 49988 Locust Rd
- 7649 Forest Dr
- 1173 Railroad Ave
- 1144 Railroad Ln
- 1174 Railroad Ave
- 1153 Silver Tip Ln
- 1163 Silver Tip Ln
- 1167 Silver Tip Ln
- 50963 Chu Ranch Rd
- 50740 Chu Ranch Rd
- 0 50.59 AC Westlake Dr
- 5657 Worman Rd
- 43555 Highway 41 Unit 54
- 43555 Highway 41 Unit A3
- 43555 Highway 41 Unit 53
- 50986 Road 632
- 43149 W Sugar Pine Dr
- 47710 Lewis Creek Rd
- 47717 Lewis Creek Rd
- 47699 Lewis Creek Rd
- 47745 Lewis Creek Rd
- 47687 Lewis Creek Rd
- 47746 Lewis Creek Rd
- 47675 Lewis Creek Rd
- 47753 Lewis Creek Rd
- 50089 Tolladay Hill Rd
- 47672 Brammer Purl Rd
- 50111 Tolladay Hill Rd
- 47767 Lewis Creek Rd
- 47657 Road 630
- 50094 Tolladay Hill Rd
- 47648 Brammer Purl Rd
- 50120 Tolladay Hill Rd
- 50133 Tolladay Hill Rd
- 5011 Tolladay Hill Rd
- 47611 Road 630
- 47802 Lewis Creek Rd