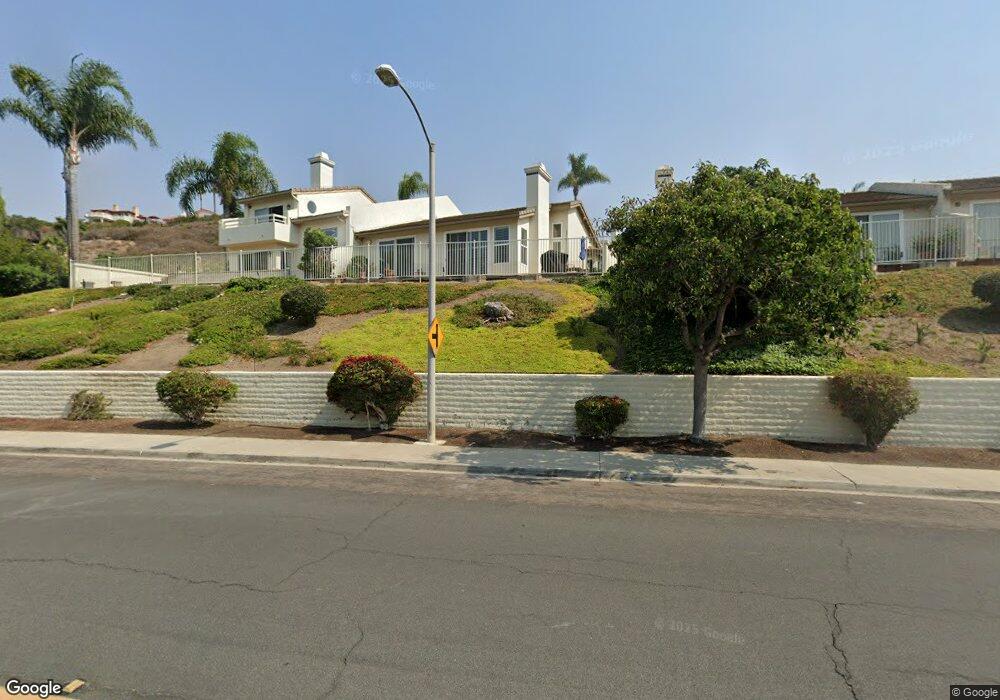
4773 Endeavor Ln Carlsbad, CA 92008
Hedionda Point NeighborhoodEstimated Value: $1,061,397 - $1,238,000
2
Beds
2
Baths
1,403
Sq Ft
$817/Sq Ft
Est. Value
About This Home
This home is located at 4773 Endeavor Ln, Carlsbad, CA 92008 and is currently estimated at $1,145,849, approximately $816 per square foot. 4773 Endeavor Ln is a home located in San Diego County with nearby schools including Kelly Elementary School, Carlsbad High School, and Sage Creek High.
Ownership History
Date
Name
Owned For
Owner Type
Purchase Details
Closed on
Feb 7, 2008
Sold by
Hulsart Beth J
Bought by
Hulsart Beth J
Current Estimated Value
Purchase Details
Closed on
Aug 26, 1999
Sold by
Ozbirn Olga Revocable Trust 12-20-95 and Ozbirn Olga
Bought by
Hulsart Beth J
Home Financials for this Owner
Home Financials are based on the most recent Mortgage that was taken out on this home.
Original Mortgage
$125,000
Outstanding Balance
$37,257
Interest Rate
7.89%
Estimated Equity
$1,108,592
Purchase Details
Closed on
Nov 4, 1996
Sold by
Ozbirn Olga
Bought by
Ozbirn Olga
Purchase Details
Closed on
Sep 3, 1996
Sold by
Ba Properties Inc
Bought by
Ozbirn Olga
Purchase Details
Closed on
Jun 21, 1996
Sold by
Simone Calhoun and Jan Dorothy
Bought by
Ba Properties Inc
Purchase Details
Closed on
Oct 27, 1993
Sold by
Burkhart Dorothy Jan and Riley Dorothy Jan
Bought by
Burkhart Richard E and Burkhart Jan
Purchase Details
Closed on
Apr 5, 1990
Purchase Details
Closed on
Apr 17, 1989
Purchase Details
Closed on
Dec 9, 1987
Create a Home Valuation Report for This Property
The Home Valuation Report is an in-depth analysis detailing your home's value as well as a comparison with similar homes in the area
Home Values in the Area
Average Home Value in this Area
Purchase History
| Date | Buyer | Sale Price | Title Company |
|---|---|---|---|
| Hulsart Beth J | -- | None Available | |
| Hulsart Beth J | $231,000 | Lawyers Title | |
| Ozbirn Olga | -- | -- | |
| Ozbirn Olga | $160,000 | First American Title | |
| Ba Properties Inc | $174,862 | Fidelity National Title | |
| Burkhart Richard E | -- | -- | |
| -- | $218,500 | -- | |
| -- | $185,300 | -- | |
| -- | $146,000 | -- |
Source: Public Records
Mortgage History
| Date | Status | Borrower | Loan Amount |
|---|---|---|---|
| Open | Hulsart Beth J | $125,000 |
Source: Public Records
Tax History Compared to Growth
Tax History
| Year | Tax Paid | Tax Assessment Tax Assessment Total Assessment is a certain percentage of the fair market value that is determined by local assessors to be the total taxable value of land and additions on the property. | Land | Improvement |
|---|---|---|---|---|
| 2025 | $3,673 | $355,014 | $161,277 | $193,737 |
| 2024 | $3,673 | $348,054 | $158,115 | $189,939 |
| 2023 | $3,652 | $341,230 | $155,015 | $186,215 |
| 2022 | $3,595 | $334,540 | $151,976 | $182,564 |
| 2021 | $3,566 | $327,982 | $148,997 | $178,985 |
| 2020 | $3,542 | $324,620 | $147,470 | $177,150 |
| 2019 | $3,477 | $318,256 | $144,579 | $173,677 |
| 2018 | $3,329 | $312,017 | $141,745 | $170,272 |
| 2017 | $90 | $305,900 | $138,966 | $166,934 |
| 2016 | $3,139 | $299,903 | $136,242 | $163,661 |
| 2015 | $3,125 | $295,399 | $134,196 | $161,203 |
| 2014 | $3,072 | $289,614 | $131,568 | $158,046 |
Source: Public Records
Map
Nearby Homes
- 4735 Bryce Cir
- 4781 Argosy Ln
- 4705 Marina Dr Unit 10
- 4747 Marina Dr Unit 23
- 4843 Flying Cloud Way
- 1741 Bruce Rd
- 4814 Refugio Ave
- 4874 Park Dr
- 4876 Park Dr
- 0 Adams St Unit OC24201399
- 4640 Sunburst Rd
- 4623 Telescope Ave
- 0 Sunny Creek Unit PI25230627
- 1095 Hoover St
- 4143 Sunnyhill Dr
- 0 Hoover St
- 0 Park Dr
- 1120 Cape Aire Ln
- 2508 Chamomile Ln
- 2541 Delphinium Ln
- 4771 Endeavor Ln
- 4777 Endeavor Ln
- 4781 Endeavor Ln
- 4783 Endeavor Ln
- 4787 Endeavor Ln
- 4773 Flying Cloud Way
- 4771 Flying Cloud Way
- 4791 Endeavor Ln
- 4777 Flying Cloud Way
- 4781 Flying Cloud Way
- 4712 Bryce Cir
- 4783 Flying Cloud Way
- 4700 Bryce Cir
- 4704 Bryce Cir
- 4787 Flying Cloud Way
- 4716 Bryce Cir
- 4791 Flying Cloud Way
- 4715 Bryce Cir
- 4793 Flying Cloud Way
- 4719 Bryce Cir