Estimated Value: $332,424 - $380,000
3
Beds
3
Baths
2,310
Sq Ft
$156/Sq Ft
Est. Value
About This Home
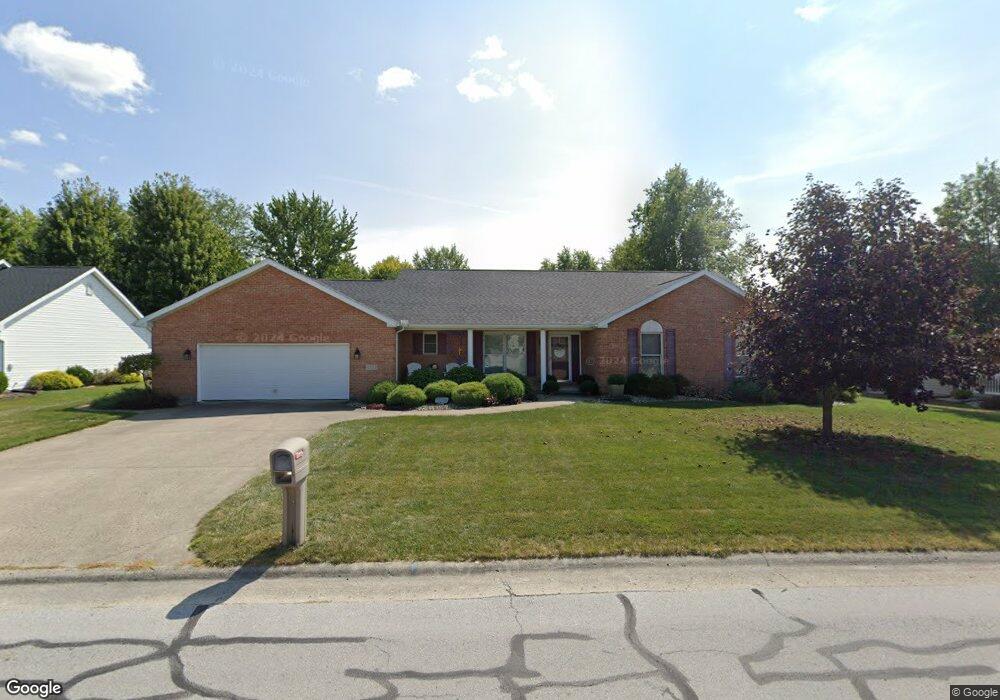
This home is located at 4773 Sycamore St, Lima, OH 45807 and is currently estimated at $359,606, approximately $155 per square foot. 4773 Sycamore St is a home located in Allen County with nearby schools including Elida Elementary School, Elida Middle School, and Elida High School.
Ownership History
Date
Name
Owned For
Owner Type
Purchase Details
Closed on
Nov 16, 2006
Sold by
Leppla Donald Michael and Leppla Sheila Dawn
Bought by
Vagedes Rebecca S
Current Estimated Value
Home Financials for this Owner
Home Financials are based on the most recent Mortgage that was taken out on this home.
Original Mortgage
$185,000
Outstanding Balance
$110,594
Interest Rate
6.4%
Mortgage Type
Purchase Money Mortgage
Estimated Equity
$249,012
Purchase Details
Closed on
Jun 15, 2001
Sold by
Cooper Veronica L
Bought by
Leppla Donald M and Leppla Sheila D
Home Financials for this Owner
Home Financials are based on the most recent Mortgage that was taken out on this home.
Original Mortgage
$99,000
Interest Rate
7.16%
Mortgage Type
New Conventional
Purchase Details
Closed on
Jun 5, 1996
Sold by
Pohlman Mark
Bought by
Nicholson Jaffrey
Home Financials for this Owner
Home Financials are based on the most recent Mortgage that was taken out on this home.
Original Mortgage
$117,200
Interest Rate
7.97%
Mortgage Type
Balloon
Create a Home Valuation Report for This Property
The Home Valuation Report is an in-depth analysis detailing your home's value as well as a comparison with similar homes in the area
Home Values in the Area
Average Home Value in this Area
Purchase History
| Date | Buyer | Sale Price | Title Company |
|---|---|---|---|
| Vagedes Rebecca S | $185,000 | None Available | |
| Leppla Donald M | $176,000 | -- | |
| Nicholson Jaffrey | $146,500 | -- |
Source: Public Records
Mortgage History
| Date | Status | Borrower | Loan Amount |
|---|---|---|---|
| Open | Vagedes Rebecca S | $185,000 | |
| Previous Owner | Leppla Donald M | $99,000 | |
| Previous Owner | Nicholson Jaffrey | $117,200 |
Source: Public Records
Tax History Compared to Growth
Tax History
| Year | Tax Paid | Tax Assessment Tax Assessment Total Assessment is a certain percentage of the fair market value that is determined by local assessors to be the total taxable value of land and additions on the property. | Land | Improvement |
|---|---|---|---|---|
| 2024 | $4,125 | $92,270 | $8,860 | $83,410 |
| 2023 | $3,580 | $71,510 | $6,860 | $64,650 |
| 2022 | $3,652 | $71,510 | $6,860 | $64,650 |
| 2021 | $3,670 | $71,510 | $6,860 | $64,650 |
| 2020 | $3,334 | $60,380 | $6,860 | $53,520 |
| 2019 | $3,334 | $60,380 | $6,860 | $53,520 |
| 2018 | $3,137 | $60,380 | $6,860 | $53,520 |
| 2017 | $2,916 | $54,220 | $6,860 | $47,360 |
| 2016 | $2,914 | $54,220 | $6,860 | $47,360 |
| 2015 | $2,933 | $54,220 | $6,860 | $47,360 |
| 2014 | $3,264 | $58,210 | $6,860 | $51,350 |
| 2013 | $2,975 | $58,210 | $6,860 | $51,350 |
Source: Public Records
Map
Nearby Homes
- 2048 Morning Glory Dr
- 4723 Amaryllis St
- 4540 East Rd
- 4901 Hummingbird St
- 4250 Diller Rd
- 4917 Pheasant St
- 4901 Lobo St
- 0000 Diller Rd
- 5126 Pheasant St
- 5103 Hummingbird St
- 2733 Lilly Dr
- 0000 Baty Rd
- 5280 Lobo St
- 3655 Diller Rd
- 4010 Neely Rd
- 213 Johns Ave
- 3790 Comanche Dr
- 3705 Comanche
- 3687 Comanche
- 3660 Comanche Dr