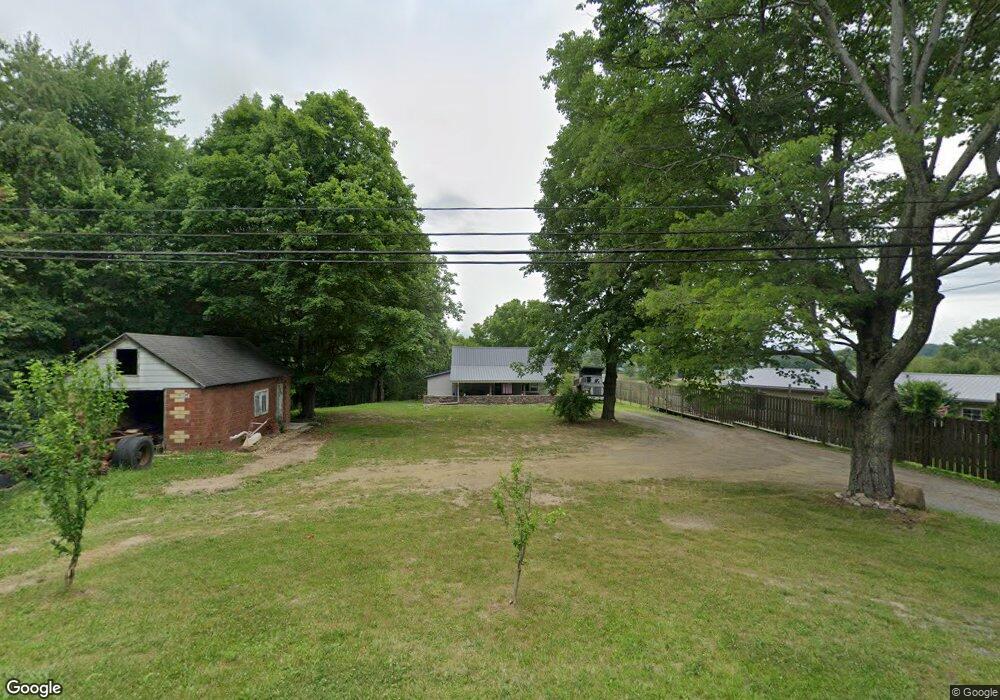
47734 Carmel Achor Rd Rogers, OH 44455
Estimated Value: $53,228 - $77,000
3
Beds
1
Bath
1,002
Sq Ft
$64/Sq Ft
Est. Value
About This Home
This home is located at 47734 Carmel Achor Rd, Rogers, OH 44455 and is currently estimated at $64,307, approximately $64 per square foot. 47734 Carmel Achor Rd is a home located in Columbiana County with nearby schools including Beaver Local High School.
Ownership History
Date
Name
Owned For
Owner Type
Purchase Details
Closed on
Sep 15, 2022
Sold by
Wengerd Andy N and Wengerd Jemima
Bought by
Baux Corey Lee
Current Estimated Value
Purchase Details
Closed on
Oct 8, 2021
Sold by
Wengerd Andy N and Wengerd Jemima
Bought by
Baux Corey Lee
Home Financials for this Owner
Home Financials are based on the most recent Mortgage that was taken out on this home.
Original Mortgage
$36,500
Interest Rate
2.8%
Mortgage Type
Land Contract Argmt. Of Sale
Purchase Details
Closed on
Jul 16, 2020
Sold by
Wilson Jennece A
Bought by
Wengerd Andy N
Purchase Details
Closed on
Jun 26, 2001
Sold by
Swinehart Wanda Brown and Swinehart Wanda J
Bought by
Melott Charles E
Home Financials for this Owner
Home Financials are based on the most recent Mortgage that was taken out on this home.
Original Mortgage
$51,765
Interest Rate
7.27%
Mortgage Type
FHA
Create a Home Valuation Report for This Property
The Home Valuation Report is an in-depth analysis detailing your home's value as well as a comparison with similar homes in the area
Purchase History
| Date | Buyer | Sale Price | Title Company |
|---|---|---|---|
| Baux Corey Lee | $46,500 | -- | |
| Baux Corey Lee | $46,500 | None Listed On Document | |
| Baux Corey Lee | $46,500 | None Available | |
| Wengerd Andy N | $30,000 | None Available | |
| Melott Charles E | $60,000 | Heritage Title Agency |
Source: Public Records
Mortgage History
| Date | Status | Borrower | Loan Amount |
|---|---|---|---|
| Previous Owner | Baux Corey Lee | $36,500 | |
| Previous Owner | Melott Charles E | $51,765 |
Source: Public Records
Tax History
| Year | Tax Paid | Tax Assessment Tax Assessment Total Assessment is a certain percentage of the fair market value that is determined by local assessors to be the total taxable value of land and additions on the property. | Land | Improvement |
|---|---|---|---|---|
| 2025 | $557 | $15,120 | $5,810 | $9,310 |
| 2024 | $555 | $14,390 | $5,530 | $8,860 |
| 2023 | $557 | $14,390 | $5,530 | $8,860 |
| 2022 | $558 | $14,390 | $5,530 | $8,860 |
| 2021 | $489 | $12,180 | $5,110 | $7,070 |
| 2020 | $458 | $11,380 | $5,110 | $6,270 |
| 2019 | $522 | $12,950 | $5,110 | $7,840 |
| 2018 | $502 | $11,800 | $4,660 | $7,140 |
| 2017 | $511 | $11,800 | $4,660 | $7,140 |
| 2016 | $255 | $5,710 | $4,690 | $1,020 |
| 2015 | $243 | $5,710 | $4,690 | $1,020 |
| 2014 | $277 | $5,710 | $4,690 | $1,020 |
Source: Public Records
Map
Nearby Homes
- 47335 Tomahawk Dr
- 47912 Tomahawk Dr
- 47813 Tomahawk Dr
- 9188 S Yuma Trail
- 48065 S Yuma Trail
- 48276 Dyke Rd
- 48945 State Route 154
- 46136 Carlisle Rd
- 9405 Jackman Rd
- 1075 Bacon Ave
- 5288 Wheathill Rd
- 873 W Main St
- 47085 Oak St
- 344 W Main St
- 167 S Market St
- 55 West St
- 3835 Linda Way
- 199 Garfield Ave
- 445 W Martin St
- 201-203 W Clark St
- 47699 Carmel Achor Rd
- 47683 Carmel Achor Rd
- 47836 Carmel Achor Rd
- 47787 Carmel Achor Rd
- 47870 Carmel Achor Rd
- 47737 Carmel Achor Rd
- 47598 Carmel Achor Rd
- 47675 Carmel Achor Rd
- 47617 Carmel Achor Rd
- 47671 Carmel Achor Rd
- 47849 Carmel Achor Rd
- 1121 47617 Carmel Achor Rd
- 7157 47617 Carmel Achor Rd
- 47892 Carmel Achor Rd
- 47916 Carmel Achor Rd
- 47533 Carmel Achor Rd
- 47721 Carmel Achor Rd
- 47494 Carmel Achor Rd
- 47976 Carmel Achor Rd
- 48012 Carmel Achor Rd
Your Personal Tour Guide
Ask me questions while you tour the home.