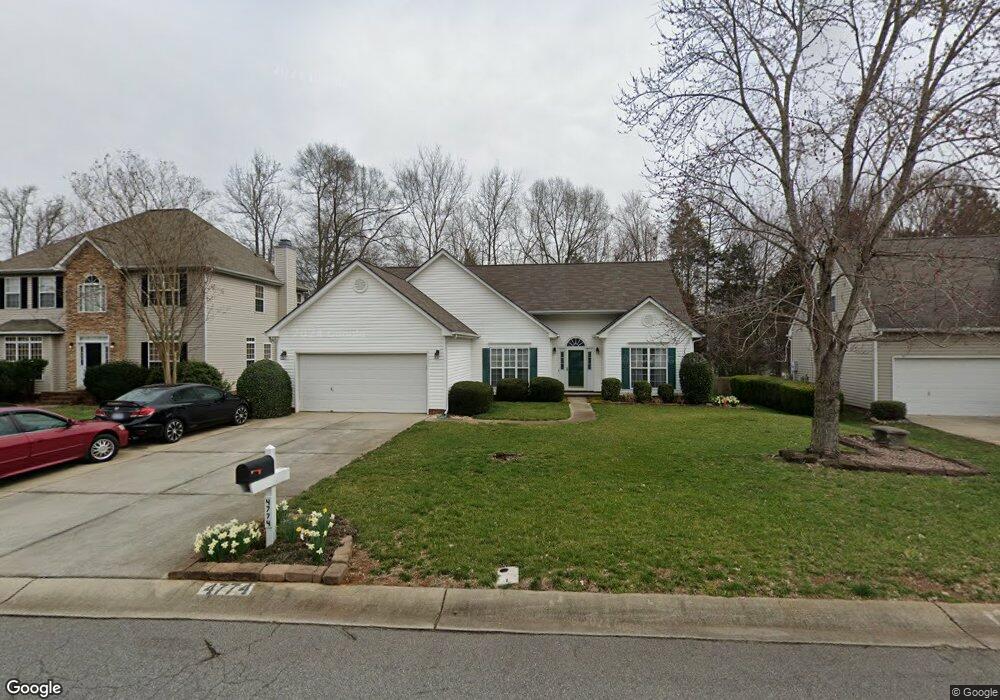
4774 Covington Dr NW Concord, NC 28027
Estimated Value: $397,867 - $413,000
3
Beds
2
Baths
1,930
Sq Ft
$209/Sq Ft
Est. Value
About This Home
This home is located at 4774 Covington Dr NW, Concord, NC 28027 and is currently estimated at $404,217, approximately $209 per square foot. 4774 Covington Dr NW is a home located in Cabarrus County with nearby schools including Carl A. Furr Elementary School, Roberta Road Middle School, and Jay M. Robinson High School.
Ownership History
Date
Name
Owned For
Owner Type
Purchase Details
Closed on
Jul 31, 2007
Sold by
Marock Robert W and Marock Elizabeth A
Bought by
Carter Richard W and Carter Cathy
Current Estimated Value
Home Financials for this Owner
Home Financials are based on the most recent Mortgage that was taken out on this home.
Original Mortgage
$102,037
Outstanding Balance
$64,770
Interest Rate
6.71%
Mortgage Type
Purchase Money Mortgage
Estimated Equity
$339,447
Purchase Details
Closed on
Apr 27, 2005
Sold by
Goodnight Ronnie R and Goodnight Janice G
Bought by
Marock Robert W and Marock Elizabeth A
Home Financials for this Owner
Home Financials are based on the most recent Mortgage that was taken out on this home.
Original Mortgage
$150,300
Interest Rate
5.37%
Mortgage Type
New Conventional
Purchase Details
Closed on
Nov 29, 2000
Sold by
Don Galloway Homes Llc
Bought by
Goodnight Ronnie R and Goodnight Janice G
Create a Home Valuation Report for This Property
The Home Valuation Report is an in-depth analysis detailing your home's value as well as a comparison with similar homes in the area
Home Values in the Area
Average Home Value in this Area
Purchase History
| Date | Buyer | Sale Price | Title Company |
|---|---|---|---|
| Carter Richard W | $195,000 | None Available | |
| Marock Robert W | $167,000 | -- | |
| Goodnight Ronnie R | $151,500 | -- |
Source: Public Records
Mortgage History
| Date | Status | Borrower | Loan Amount |
|---|---|---|---|
| Open | Carter Richard W | $102,037 | |
| Previous Owner | Marock Robert W | $150,300 |
Source: Public Records
Tax History Compared to Growth
Tax History
| Year | Tax Paid | Tax Assessment Tax Assessment Total Assessment is a certain percentage of the fair market value that is determined by local assessors to be the total taxable value of land and additions on the property. | Land | Improvement |
|---|---|---|---|---|
| 2025 | -- | $371,170 | $90,000 | $281,170 |
| 2024 | $3,697 | $371,170 | $90,000 | $281,170 |
| 2023 | $2,502 | $205,090 | $55,000 | $150,090 |
| 2022 | $2,502 | $205,090 | $55,000 | $150,090 |
| 2021 | $2,502 | $205,090 | $55,000 | $150,090 |
| 2020 | $2,502 | $205,090 | $55,000 | $150,090 |
| 2019 | $2,026 | $166,070 | $33,000 | $133,070 |
| 2018 | $1,993 | $166,070 | $33,000 | $133,070 |
| 2017 | $1,960 | $166,070 | $33,000 | $133,070 |
| 2016 | $1,162 | $152,900 | $33,000 | $119,900 |
| 2015 | -- | $152,900 | $33,000 | $119,900 |
| 2014 | -- | $152,900 | $33,000 | $119,900 |
Source: Public Records
Map
Nearby Homes
- 4769 Covington Dr NW
- 4803 Chesney St NW
- 4831 Turnridge Ct NW
- 5550 Monticello Dr NW
- 4827 Chesney St NW
- 4835 Chesney St NW
- 5711 Monticello Dr NW
- 5811 Monticello Dr NW
- 1735 Park Grove Place NW
- 159 Pitts School Rd NW
- 5807 Monticello Dr NW
- 5772 Gettysburg Dr NW
- 5619 Weddington Rd
- 2848 Ridge Crossing Ct NW
- 5820 Wingate Way NW
- 2862 Walsh Dr NW Unit 99
- 1507 Chadmore Ln NW
- 4940 Weddington Rd NW
- 1231 Bennington Dr NW
- 00 Pitts School Rd
- 4776 Covington Dr NW
- 4776 Covington Dr NW Unit 265
- 4772 Covington Dr NW
- 4729 Lauren Glen St NW
- 4778 Covington Dr NW
- 4725 Lauren Glen St NW
- 4733 Lauren Glen St NW
- 4770 Covington Dr NW
- 4737 Lauren Glen St NW
- 4775 Covington Dr NW
- 4777 Covington Dr NW
- 4780 Covington Dr NW
- 4779 Covington Dr NW
- 4721 Lauren Glen St NW
- 4771 Covington Dr NW
- 4773 Covington Dr NW
- 4781 Covington Dr NW
- 4782 Covington Dr NW
- 4745 Lauren Glen St NW
- 4746 Turnridge Ct NW