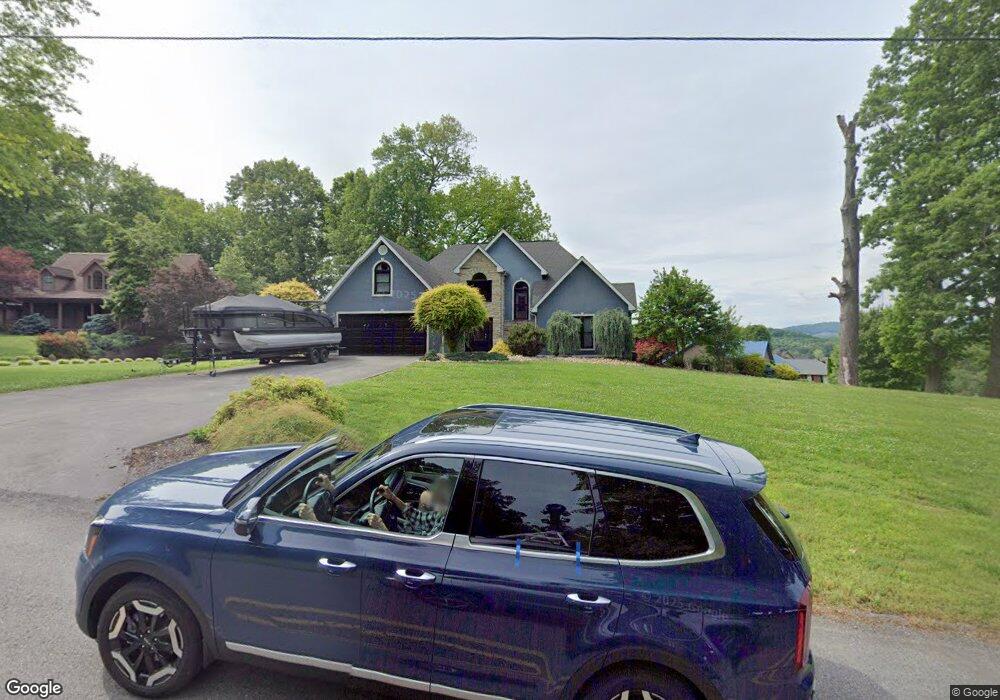
4775 Brights Pike Morristown, TN 37814
Estimated Value: $413,715 - $692,000
--
Bed
3
Baths
2,495
Sq Ft
$226/Sq Ft
Est. Value
About This Home
This home is located at 4775 Brights Pike, Morristown, TN 37814 and is currently estimated at $564,679, approximately $226 per square foot. 4775 Brights Pike is a home located in Hamblen County with nearby schools including Russellville Elementary School, East Ridge Middle School, and Morristown East High School.
Ownership History
Date
Name
Owned For
Owner Type
Purchase Details
Closed on
May 27, 2011
Sold by
Cartwright William W
Bought by
Smith Karla W and Smith Curtis
Current Estimated Value
Purchase Details
Closed on
Oct 29, 1998
Sold by
Jarnagin Benjamin B
Bought by
Glass Terry
Purchase Details
Closed on
Sep 9, 1996
Bought by
Cartwright William
Purchase Details
Closed on
Jul 16, 1993
Bought by
Carter Robert J and Carter Jennifer
Purchase Details
Closed on
Jul 1, 1991
Bought by
H J F
Purchase Details
Closed on
Jun 27, 1991
Bought by
H J F
Purchase Details
Closed on
Jun 25, 1991
Bought by
H J F
Purchase Details
Closed on
Oct 5, 1990
Bought by
Jfh
Purchase Details
Closed on
Aug 20, 1990
Bought by
Gose Gene K and Gose James H
Purchase Details
Closed on
Dec 11, 1981
Bought by
Gose Gene K and Gose James H
Purchase Details
Closed on
Sep 21, 1981
Create a Home Valuation Report for This Property
The Home Valuation Report is an in-depth analysis detailing your home's value as well as a comparison with similar homes in the area
Home Values in the Area
Average Home Value in this Area
Purchase History
| Date | Buyer | Sale Price | Title Company |
|---|---|---|---|
| Smith Karla W | $250,000 | -- | |
| Glass Terry | $8,000 | -- | |
| Cartwright William | $225,000 | -- | |
| Carter Robert J | $20,000 | -- | |
| H J F | -- | -- | |
| H J F | -- | -- | |
| H J F | -- | -- | |
| Jfh | -- | -- | |
| Gose Gene K | -- | -- | |
| Gose Gene K | -- | -- | |
| -- | -- | -- |
Source: Public Records
Tax History Compared to Growth
Tax History
| Year | Tax Paid | Tax Assessment Tax Assessment Total Assessment is a certain percentage of the fair market value that is determined by local assessors to be the total taxable value of land and additions on the property. | Land | Improvement |
|---|---|---|---|---|
| 2024 | $1,558 | $79,100 | $13,625 | $65,475 |
| 2023 | $1,558 | $79,100 | $0 | $0 |
| 2022 | $1,558 | $79,100 | $13,625 | $65,475 |
| 2021 | $1,558 | $79,100 | $13,625 | $65,475 |
| 2020 | $1,558 | $79,100 | $13,625 | $65,475 |
| 2019 | $1,356 | $63,675 | $10,225 | $53,450 |
| 2018 | $1,356 | $63,675 | $10,225 | $53,450 |
| 2017 | $1,356 | $63,675 | $10,225 | $53,450 |
| 2016 | $1,267 | $63,675 | $10,225 | $53,450 |
| 2015 | $1,178 | $63,675 | $10,225 | $53,450 |
| 2014 | -- | $63,675 | $10,225 | $53,450 |
| 2013 | -- | $68,125 | $0 | $0 |
Source: Public Records
Map
Nearby Homes
- 4801 Harbor Dr
- 4119 Azalea Ct
- Lot 17 Waters Edge Dr
- 4547 Brights Pike
- 4959 Brights Pike
- 3800 Dan Dr
- 4110 Harbor View Dr
- 4086 Harbor View Dr
- 4041 Harbor View Dr
- 5110 Anne Cir
- 2551 Cedar Creek Rd
- 465 Livingston Rd
- 3835 High Oak Dr
- 4475 Copeland Dr
- 5601 Brights Pike
- 4146 Leslie Dr
- 5556 Denton Dr
- 3409 Copper Ridge Rd
- 1708 Boardwalk Cir
- 4762 Fowler Dr
- 4761 Brights Pike
- 4780 Fowler Dr
- 4770 Brights Pike
- 4784 Fowler Dr
- 4746 Fowler Dr
- 4780 Brights Pike
- 4755 Fowler Dr
- 4732 Fowler Dr
- 4798 Fowler Dr
- 4835 Harbor Dr
- 4741 Fowler Dr
- 4720 Fowler Dr
- 4812 Harbor Dr
- 4648 Crosswinds Dr
- 4721 Fowler Dr
- 4805 Fowler Dr
- 4808 Fowler Dr
- 4825 Harbor Dr
- 4640 Crosswinds Dr