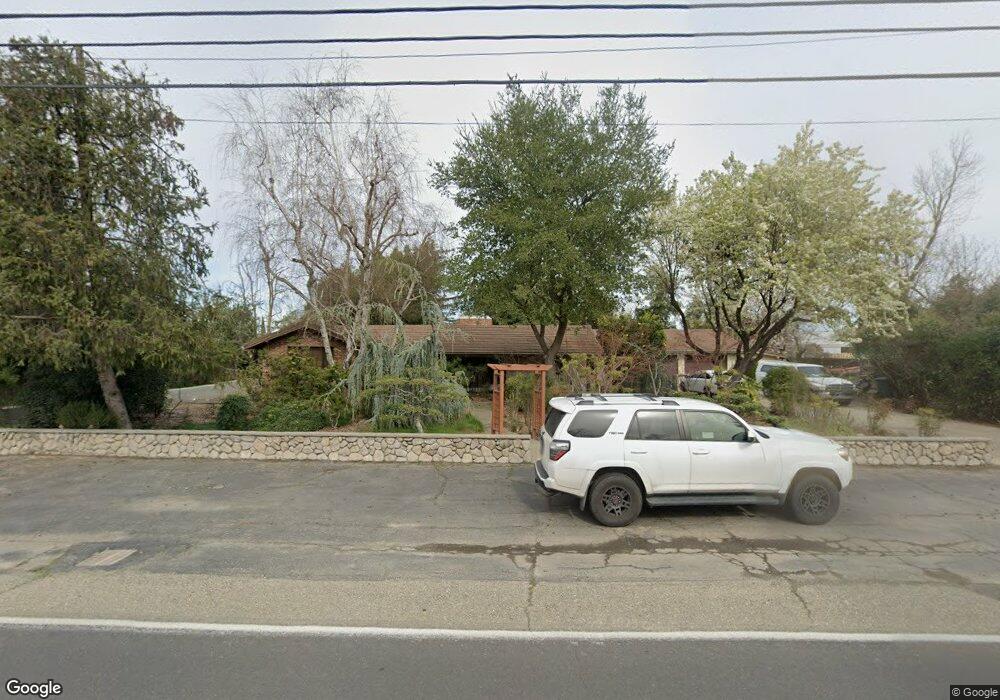
4775 E Woodbridge Rd Acampo, CA 95220
Estimated Value: $685,000 - $1,204,009
4
Beds
2
Baths
2,114
Sq Ft
$449/Sq Ft
Est. Value
About This Home
This home is located at 4775 E Woodbridge Rd, Acampo, CA 95220 and is currently estimated at $949,752, approximately $449 per square foot. 4775 E Woodbridge Rd is a home located in San Joaquin County with nearby schools including Houston School, Lodi High School, and St. Anne Elementary School.
Create a Home Valuation Report for This Property
The Home Valuation Report is an in-depth analysis detailing your home's value as well as a comparison with similar homes in the area
Tax History
| Year | Tax Paid | Tax Assessment Tax Assessment Total Assessment is a certain percentage of the fair market value that is determined by local assessors to be the total taxable value of land and additions on the property. | Land | Improvement |
|---|---|---|---|---|
| 2025 | $1,641 | $130,896 | $20,833 | $110,063 |
| 2024 | $1,602 | $128,330 | $20,425 | $107,905 |
| 2023 | $1,586 | $125,815 | $20,025 | $105,790 |
| 2022 | $1,555 | $123,349 | $19,633 | $103,716 |
| 2021 | $1,567 | $120,932 | $19,249 | $101,683 |
| 2020 | $1,265 | $119,693 | $19,052 | $100,641 |
| 2019 | $1,248 | $117,347 | $18,679 | $98,668 |
| 2018 | $1,229 | $115,047 | $18,313 | $96,734 |
| 2017 | $1,200 | $112,792 | $17,954 | $94,838 |
| 2016 | $1,125 | $110,581 | $17,602 | $92,979 |
| 2014 | $1,093 | $106,787 | $16,998 | $89,789 |
Source: Public Records
Map
Nearby Homes
- 19690 N Highway 99 Unit 26
- 19690 N Highway 99 Unit 7
- 19690 N Highway 99 Unit 8
- 19690 N Highway 99 Unit 18
- 19690 N Highway 99 Unit 162
- 19690 California 99 Unit 110
- 19690 California 99 Unit 121
- 19690 California 99 Unit 27
- 20388 N State Route 99 E Fron
- 43 Rio Vista Dr
- 19450 Hidden Lakes Ln
- 177 San Marcos Dr
- 2948 E Woodbridge Rd
- 1258 Rivergate Dr
- 0 W Turner Rd Unit 226006338
- 322 W Turner Rd
- 625 N Sacramento St
- 518 N Church St
- 1729 Le Bec Ct
- 211 N Garfield St
- 4851 E Woodbridge Rd
- 4754 E Woodbridge Rd
- 4772 E Woodbridge Rd
- 4734 E Woodbridge Rd
- 4865 E Woodbridge Rd
- 4678 E Woodbridge Rd
- 4860 E Woodbridge Rd
- 19690 N Highway 99 Unit 173
- 19690 N Highway 99
- 19690 N Highway 99 Unit 19
- 19690 N Highway 99 Unit 135
- 19690 N Highway 99 Unit 55
- 19690 N Highway 99 Unit 26
- 19690 N Highway 99 Unit 96
- 19690 N Highway 99 Unit 8
- 19690 N Highway 99 Unit 47
- 19690 N Highway 99
- 19690 N Highway 99 Unit 72
- 19690 N Highway 99 Unit 16
- 19690 N Highway 99 Unit 155
Your Personal Tour Guide
Ask me questions while you tour the home.