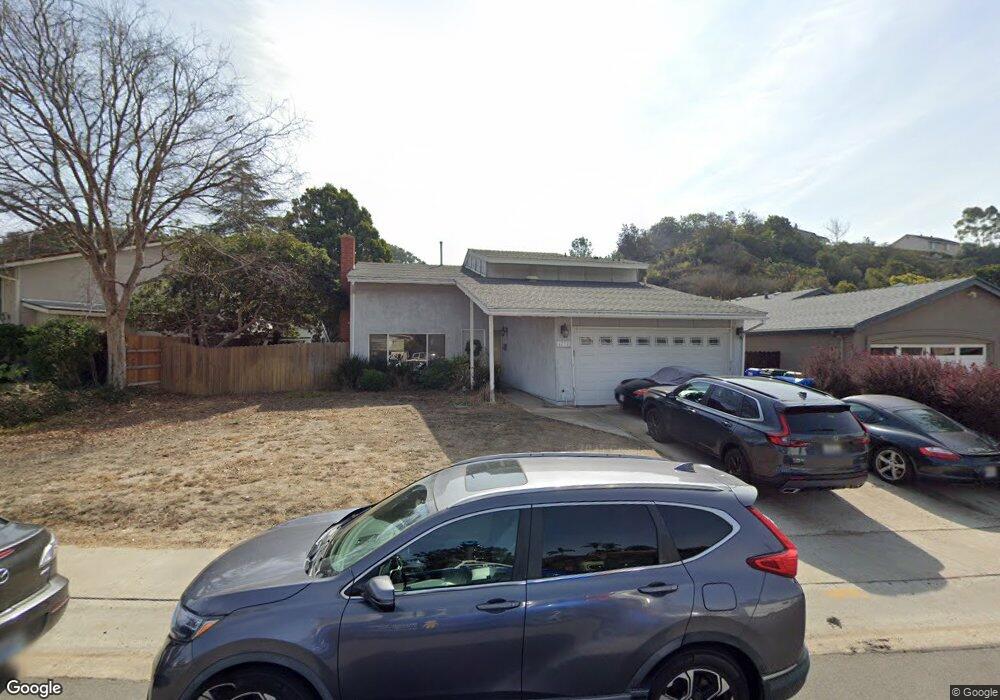
4775 Robbins St San Diego, CA 92122
University City NeighborhoodEstimated Value: $1,292,478 - $1,588,000
3
Beds
3
Baths
1,536
Sq Ft
$969/Sq Ft
Est. Value
About This Home
This home is located at 4775 Robbins St, San Diego, CA 92122 and is currently estimated at $1,488,120, approximately $968 per square foot. 4775 Robbins St is a home located in San Diego County with nearby schools including Marie Curie Elementary School, Standley Middle School, and University City High School.
Ownership History
Date
Name
Owned For
Owner Type
Purchase Details
Closed on
Sep 23, 2013
Sold by
Lilley Kevin J and Olivier Lilley Gay L
Bought by
Lilley Kevin J and Olivier Lilley Gay L
Current Estimated Value
Home Financials for this Owner
Home Financials are based on the most recent Mortgage that was taken out on this home.
Original Mortgage
$289,500
Outstanding Balance
$70,819
Interest Rate
3.55%
Mortgage Type
New Conventional
Estimated Equity
$1,417,301
Purchase Details
Closed on
Jan 26, 2010
Sold by
Lilley Kevin J and Olivier Lilley Gay L
Bought by
Lilley Kevin J and Olivier Lilley Gay L
Home Financials for this Owner
Home Financials are based on the most recent Mortgage that was taken out on this home.
Original Mortgage
$304,000
Interest Rate
4.91%
Mortgage Type
New Conventional
Purchase Details
Closed on
Jun 10, 2004
Sold by
Lilley Kevin and Olivier Lilley Gay
Bought by
Lilley Kevin J and Olivier Lilley Gay L
Purchase Details
Closed on
Sep 17, 1997
Sold by
Guzinski Phillip J and Guzinski Donna J
Bought by
Lilley Kevin and Olivier Lilley Gay
Home Financials for this Owner
Home Financials are based on the most recent Mortgage that was taken out on this home.
Original Mortgage
$161,800
Interest Rate
7.54%
Purchase Details
Closed on
Apr 24, 1989
Create a Home Valuation Report for This Property
The Home Valuation Report is an in-depth analysis detailing your home's value as well as a comparison with similar homes in the area
Home Values in the Area
Average Home Value in this Area
Purchase History
| Date | Buyer | Sale Price | Title Company |
|---|---|---|---|
| Lilley Kevin J | -- | Chicago Title Company | |
| Lilley Kevin J | -- | Chicago Title Company | |
| Lilley Kevin J | -- | Accommodation | |
| Lilley Kevin J | -- | Ticor Title Company | |
| Lilley Kevin J | -- | -- | |
| Lilley Kevin | $224,500 | Benefit Land Title Company | |
| -- | $250,000 | -- |
Source: Public Records
Mortgage History
| Date | Status | Borrower | Loan Amount |
|---|---|---|---|
| Open | Lilley Kevin J | $289,500 | |
| Closed | Lilley Kevin J | $304,000 | |
| Closed | Lilley Kevin | $161,800 |
Source: Public Records
Tax History Compared to Growth
Tax History
| Year | Tax Paid | Tax Assessment Tax Assessment Total Assessment is a certain percentage of the fair market value that is determined by local assessors to be the total taxable value of land and additions on the property. | Land | Improvement |
|---|---|---|---|---|
| 2025 | $4,260 | $358,044 | $202,375 | $155,669 |
| 2024 | $4,260 | $351,024 | $198,407 | $152,617 |
| 2023 | $4,164 | $344,142 | $194,517 | $149,625 |
| 2022 | $4,052 | $337,395 | $190,703 | $146,692 |
| 2021 | $4,022 | $330,780 | $186,964 | $143,816 |
| 2020 | $3,973 | $327,389 | $185,047 | $142,342 |
| 2019 | $3,901 | $320,970 | $181,419 | $139,551 |
| 2018 | $3,646 | $314,677 | $177,862 | $136,815 |
| 2017 | $3,558 | $308,508 | $174,375 | $134,133 |
| 2016 | $3,499 | $302,459 | $170,956 | $131,503 |
| 2015 | $3,447 | $297,917 | $168,389 | $129,528 |
| 2014 | $3,392 | $292,082 | $165,091 | $126,991 |
Source: Public Records
Map
Nearby Homes
- 6690 Gullstrand St
- 4545 Benhurst Ave
- 4955 Corlita Ct
- 4627 Huggins St
- 6216 Agee St
- 6204 Agee St Unit 130
- 5746 Ferber St
- 6182 Agee St Unit 193
- 5889 Cozzens St
- 7180 Shoreline Dr Unit 5108
- 5865 Cozzens St
- 6350 Genesee Ave Unit 204
- 6330 Genesee Ave Unit 112
- 6330 Genesee Ave Unit 220
- 6350 Genesee Ave Unit 220
- 6330 Genesee Ave Unit 213
- 6350 Genesee Ave Unit 108
- 7130 Shoreline Dr Unit 1103
- 5242 Cobb Place
- 7122 Calabria Ct Unit E
- 4763 Robbins St
- 4785 Robbins St
- 6760 Gullstrand St
- 4751 Robbins St
- 4795 Robbins St
- 4741 Robbins St
- 4768 Robbins St
- 4758 Robbins St
- 6825 Robbins Ct
- 4748 Robbins St
- 4729 Robbins St
- 4738 Robbins St
- 4790 Robbins St
- 4728 Robbins St
- 6845 Robbins Ct
- 4720 Robbins St
- 4719 Robbins St
- 6840 Robbins Ct
- 4712 Robbins St
- 6840 Gullstrand St