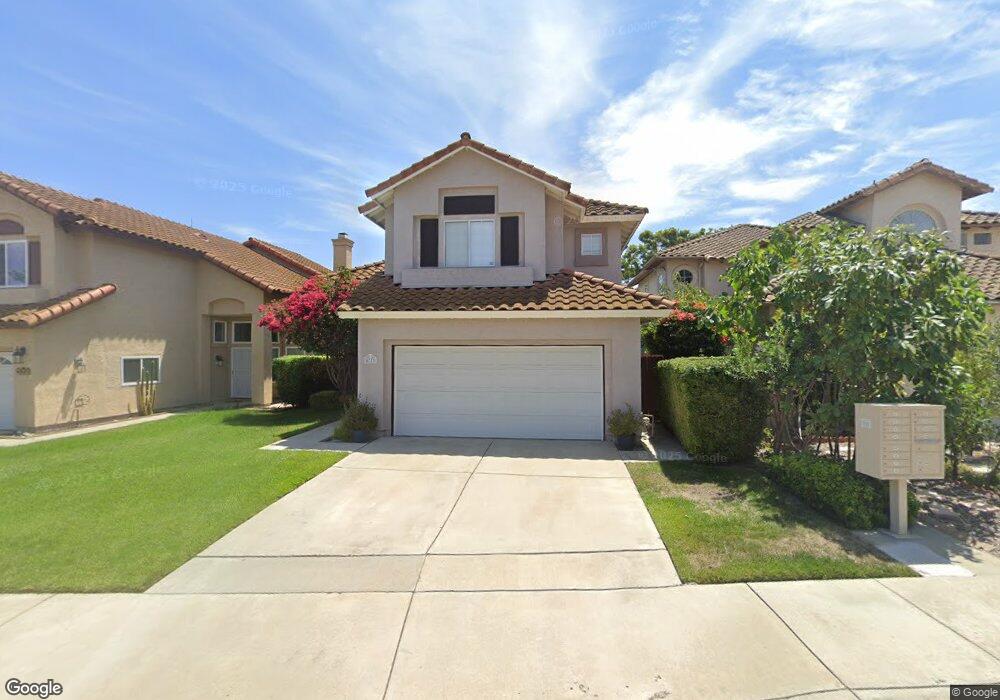
4775 Via Colorado Oceanside, CA 92056
Ivey Ranch-Rancho Del Oro NeighborhoodEstimated Value: $860,244 - $937,000
3
Beds
3
Baths
1,817
Sq Ft
$500/Sq Ft
Est. Value
About This Home
This home is located at 4775 Via Colorado, Oceanside, CA 92056 and is currently estimated at $908,811, approximately $500 per square foot. 4775 Via Colorado is a home located in San Diego County with nearby schools including Empresa Elementary School, Roosevelt Middle School, and Vista High School.
Ownership History
Date
Name
Owned For
Owner Type
Purchase Details
Closed on
May 19, 2010
Sold by
Morin Jacques and Morin Ayeshah
Bought by
Pease Marc A and Pease Jaimee M
Current Estimated Value
Home Financials for this Owner
Home Financials are based on the most recent Mortgage that was taken out on this home.
Original Mortgage
$340,415
Outstanding Balance
$224,788
Interest Rate
4.75%
Mortgage Type
FHA
Estimated Equity
$684,023
Purchase Details
Closed on
Apr 25, 2005
Sold by
Lyon William C and Lyon Aster S
Bought by
Morin Jacques and Morin Ayeshah
Home Financials for this Owner
Home Financials are based on the most recent Mortgage that was taken out on this home.
Original Mortgage
$420,000
Interest Rate
1.37%
Mortgage Type
Negative Amortization
Purchase Details
Closed on
Sep 22, 1989
Create a Home Valuation Report for This Property
The Home Valuation Report is an in-depth analysis detailing your home's value as well as a comparison with similar homes in the area
Home Values in the Area
Average Home Value in this Area
Purchase History
| Date | Buyer | Sale Price | Title Company |
|---|---|---|---|
| Pease Marc A | $345,000 | Stewart Title Of California | |
| Morin Jacques | $525,000 | Chicago Title | |
| -- | $199,600 | -- |
Source: Public Records
Mortgage History
| Date | Status | Borrower | Loan Amount |
|---|---|---|---|
| Open | Pease Marc A | $340,415 | |
| Previous Owner | Morin Jacques | $420,000 |
Source: Public Records
Tax History Compared to Growth
Tax History
| Year | Tax Paid | Tax Assessment Tax Assessment Total Assessment is a certain percentage of the fair market value that is determined by local assessors to be the total taxable value of land and additions on the property. | Land | Improvement |
|---|---|---|---|---|
| 2025 | $4,705 | $445,317 | $253,886 | $191,431 |
| 2024 | $4,705 | $436,586 | $248,908 | $187,678 |
| 2023 | $4,590 | $428,027 | $244,028 | $183,999 |
| 2022 | $4,577 | $419,636 | $239,244 | $180,392 |
| 2021 | $4,474 | $411,408 | $234,553 | $176,855 |
| 2020 | $8,555 | $407,190 | $232,148 | $175,042 |
| 2019 | $8,488 | $399,207 | $227,597 | $171,610 |
| 2018 | $8,270 | $391,381 | $223,135 | $168,246 |
| 2017 | $71 | $383,708 | $218,760 | $164,948 |
| 2016 | $8,073 | $376,185 | $214,471 | $161,714 |
| 2015 | $8,066 | $370,535 | $211,250 | $159,285 |
| 2014 | $7,967 | $363,277 | $207,112 | $156,165 |
Source: Public Records
Map
Nearby Homes
- 4964 Calle Sobrado
- 1267 Via Lucero
- 4620 Los Alamos Way Unit D
- 1275 Natoma Way Unit B
- 1018 Plover Way
- 4384 Nautilus Way Unit 8
- 1024 Eider Way
- 1137 Avenida Sobrina
- 4372 Pacifica Way Unit 6
- 4395 Albatross Way
- 1702 Havenwood Dr Unit 1087D4
- 1216 Woodview Dr
- 4321 Star Path Way Unit 3
- 4428 Skimmer Way
- 4369 Dowitcher Way
- 5174 Avenida de la Plata
- 4302 Pacifica Way Unit 2
- 942 Royal Tern Way
- 1328 Woodhaven Dr
- 5063 Frazee Rd
- 4787 Via Colorado
- 4767 Via Colorado
- 4795 Via Colorado
- 4778 Via Escala
- 4770 Via Escala
- 4786 Via Escala
- 4747 Via Colorado
- 4794 Via Escala
- 4762 Via Escala
- 4774 Via Colorado
- 4782 Via Colorado
- 4760 Via Colorado
- 4735 Via Colorado
- 4754 Via Escala
- 4790 Via Colorado
- 4754 Via Colorado
- 4794 Via Colorado
- 4748 Via Escala
- 1566 Avenida Mantilla
- 4742 Via Colorado