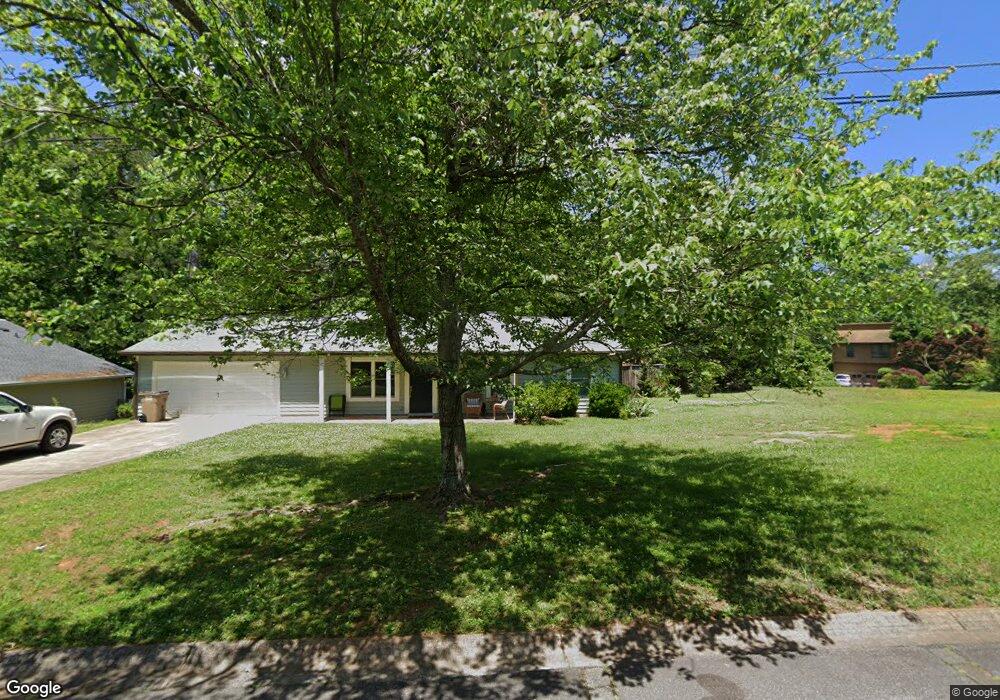
4776 Jamerson Forest Cir Marietta, GA 30066
Sandy Plains NeighborhoodEstimated Value: $364,000 - $386,000
3
Beds
2
Baths
1,360
Sq Ft
$276/Sq Ft
Est. Value
About This Home
This home is located at 4776 Jamerson Forest Cir, Marietta, GA 30066 and is currently estimated at $374,815, approximately $275 per square foot. 4776 Jamerson Forest Cir is a home located in Cobb County with nearby schools including Keheley Elementary School, McCleskey Middle School, and The Garden School.
Ownership History
Date
Name
Owned For
Owner Type
Purchase Details
Closed on
Sep 14, 2015
Sold by
Bowman Allison
Bought by
Horn Matthew
Current Estimated Value
Home Financials for this Owner
Home Financials are based on the most recent Mortgage that was taken out on this home.
Original Mortgage
$137,082
Outstanding Balance
$55,175
Interest Rate
4.4%
Mortgage Type
FHA
Estimated Equity
$319,640
Purchase Details
Closed on
Aug 28, 2009
Sold by
Bowman Alison
Bought by
Bowman Alison and Horn Mary
Home Financials for this Owner
Home Financials are based on the most recent Mortgage that was taken out on this home.
Original Mortgage
$99,206
Interest Rate
5.14%
Mortgage Type
FHA
Purchase Details
Closed on
Oct 28, 2002
Sold by
Bishop Stacy
Bought by
Wilson Jennifer K and Wilson Joseph T
Home Financials for this Owner
Home Financials are based on the most recent Mortgage that was taken out on this home.
Original Mortgage
$105,600
Interest Rate
6.01%
Mortgage Type
New Conventional
Create a Home Valuation Report for This Property
The Home Valuation Report is an in-depth analysis detailing your home's value as well as a comparison with similar homes in the area
Home Values in the Area
Average Home Value in this Area
Purchase History
| Date | Buyer | Sale Price | Title Company |
|---|---|---|---|
| Horn Matthew | -- | -- | |
| Bowman Alison | -- | -- | |
| Bowman Alison | $130,000 | -- | |
| Wilson Jennifer K | $132,000 | -- |
Source: Public Records
Mortgage History
| Date | Status | Borrower | Loan Amount |
|---|---|---|---|
| Open | Horn Matthew | $137,082 | |
| Previous Owner | Bowman Alison | $99,206 | |
| Previous Owner | Wilson Jennifer K | $105,600 | |
| Previous Owner | Wilson Jennifer K | $19,800 |
Source: Public Records
Tax History Compared to Growth
Tax History
| Year | Tax Paid | Tax Assessment Tax Assessment Total Assessment is a certain percentage of the fair market value that is determined by local assessors to be the total taxable value of land and additions on the property. | Land | Improvement |
|---|---|---|---|---|
| 2025 | $4,240 | $140,724 | $36,000 | $104,724 |
| 2024 | $3,741 | $124,092 | $28,800 | $95,292 |
| 2023 | $3,741 | $124,092 | $28,800 | $95,292 |
| 2022 | $3,449 | $113,648 | $24,000 | $89,648 |
| 2021 | $3,016 | $99,360 | $22,000 | $77,360 |
| 2020 | $2,808 | $92,516 | $22,000 | $70,516 |
| 2019 | $2,220 | $73,152 | $18,000 | $55,152 |
| 2018 | $2,220 | $73,152 | $18,000 | $55,152 |
| 2017 | $1,829 | $63,632 | $18,000 | $45,632 |
| 2016 | $1,559 | $54,212 | $17,100 | $37,112 |
| 2015 | $1,336 | $54,212 | $17,100 | $37,112 |
| 2014 | $1,097 | $45,752 | $0 | $0 |
Source: Public Records
Map
Nearby Homes
- 1513 Jamerson Landing
- 4791 Jamerson Forest Cir
- 4758 Jamerson Forest Cir
- 1634 Barrier Rd
- 1528 Forest Trace
- 4680 Jamerson Forest Pkwy
- 2899 Treeside Terrace
- 4941 Willow Ln
- 4924 Locklear Way
- 1765 Blackwillow Dr
- 4782 Jamerson Creek Ct
- 5009 Kingsley Manor Ct
- 4422 Inlet Rd
- 4592 N Landing Dr
- 4813 Highpoint Dr NE
- 4413 Inlet Rd
- 4509 N Bay Ct
- 4314 Keheley Lake Ct NE
- 4778 Jamerson Forest Cir
- 4778 Jamerson Forest Cir
- 4773 Jamerson Forest Cir
- 4775 Jamerson Forest Cir
- 4726 Rubes Creek Ct Unit 4
- 4780 Jamerson Forest Cir Unit 4
- 4777 Jamerson Forest Cir
- 4727 Rubes Creek Ct
- 4771 Jamerson Forest Cir
- 4728 Rubes Creek Ct
- 4772 Jamerson Forest Cir
- 1526 Rubes Landing Unit 4
- 4782 Jamerson Forest Cir
- 4779 Jamerson Forest Cir
- 4769 Jamerson Forest Cir Unit 11
- 4769 Jamerson Forest Cir Unit 11
- 4769 Jamerson Forest Cir Unit 4
- 4770 Jamerson Forest Cir
- 1524 Rubes Landing
- 1528 Rubes Landing Unit 4