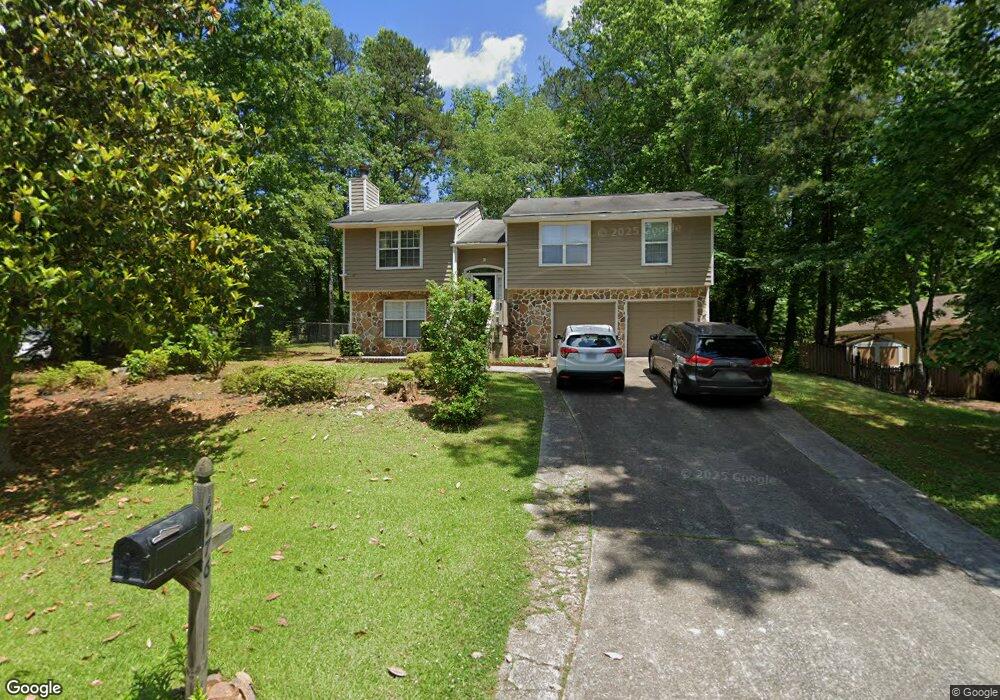
4776 Jamerson Forest Pkwy Marietta, GA 30066
Sandy Plains NeighborhoodEstimated Value: $361,000 - $413,000
3
Beds
2
Baths
1,322
Sq Ft
$288/Sq Ft
Est. Value
About This Home
This home is located at 4776 Jamerson Forest Pkwy, Marietta, GA 30066 and is currently estimated at $381,188, approximately $288 per square foot. 4776 Jamerson Forest Pkwy is a home located in Cobb County with nearby schools including Keheley Elementary School, McCleskey Middle School, and The Garden School.
Ownership History
Date
Name
Owned For
Owner Type
Purchase Details
Closed on
Apr 29, 2010
Sold by
Hud & Housing Of Urban Dev
Bought by
Temniss Abdelhamid and Elsaid Fatme
Current Estimated Value
Home Financials for this Owner
Home Financials are based on the most recent Mortgage that was taken out on this home.
Original Mortgage
$111,804
Outstanding Balance
$75,382
Interest Rate
5.25%
Mortgage Type
FHA
Estimated Equity
$305,806
Purchase Details
Closed on
May 5, 2009
Sold by
Midfirst Bk
Bought by
Hud-Housing Of Urban Dev
Purchase Details
Closed on
Jul 3, 2001
Sold by
Doughty Daniel H
Bought by
Chavez Norberto
Home Financials for this Owner
Home Financials are based on the most recent Mortgage that was taken out on this home.
Original Mortgage
$132,790
Interest Rate
7.17%
Mortgage Type
FHA
Create a Home Valuation Report for This Property
The Home Valuation Report is an in-depth analysis detailing your home's value as well as a comparison with similar homes in the area
Home Values in the Area
Average Home Value in this Area
Purchase History
| Date | Buyer | Sale Price | Title Company |
|---|---|---|---|
| Temniss Abdelhamid | $101,000 | -- | |
| Hud-Housing Of Urban Dev | -- | -- | |
| Midfirst Bk | $127,381 | -- | |
| Chavez Norberto | $133,900 | -- |
Source: Public Records
Mortgage History
| Date | Status | Borrower | Loan Amount |
|---|---|---|---|
| Open | Temniss Abdelhamid | $111,804 | |
| Previous Owner | Chavez Norberto | $132,790 |
Source: Public Records
Tax History Compared to Growth
Tax History
| Year | Tax Paid | Tax Assessment Tax Assessment Total Assessment is a certain percentage of the fair market value that is determined by local assessors to be the total taxable value of land and additions on the property. | Land | Improvement |
|---|---|---|---|---|
| 2025 | $4,164 | $138,208 | $36,000 | $102,208 |
| 2024 | $4,024 | $133,456 | $28,800 | $104,656 |
| 2023 | $4,024 | $133,456 | $28,800 | $104,656 |
| 2022 | $3,703 | $122,024 | $24,000 | $98,024 |
| 2021 | $3,021 | $99,536 | $22,000 | $77,536 |
| 2020 | $2,884 | $95,036 | $22,000 | $73,036 |
| 2019 | $2,378 | $78,344 | $18,000 | $60,344 |
| 2018 | $2,378 | $78,344 | $18,000 | $60,344 |
| 2017 | $1,942 | $67,548 | $18,000 | $49,548 |
| 2016 | $1,675 | $58,268 | $17,100 | $41,168 |
| 2015 | $1,717 | $58,268 | $17,100 | $41,168 |
| 2014 | $1,200 | $40,400 | $0 | $0 |
Source: Public Records
Map
Nearby Homes
- 2899 Treeside Terrace
- 4680 Jamerson Forest Pkwy
- 4816 Olde Mill Dr
- 1513 Jamerson Landing
- 1528 Forest Trace
- 4758 Jamerson Forest Cir
- 1634 Barrier Rd
- 4941 Willow Ln
- 4855 Rockford Ridge Dr
- 4422 Inlet Rd
- 4413 Inlet Rd
- 4924 Locklear Way
- 1765 Blackwillow Dr
- 1244 Hickory Wood Dr NE
- 5009 Kingsley Manor Ct
- 4262 Inlet Rd
- 933 Old Noonday Sch House Rd
- 4314 Keheley Lake Ct NE
- 4764 Jamerson Forest Pkwy
- 4775 Jamerson Forest Pkwy
- 4785 Jamerson Forest Pkwy
- 4752 Jamerson Forest Pkwy
- 4763 Jamerson Forest Pkwy Unit 5
- 4763 Jamerson Forest Pkwy
- 4791 Rubes Creek Dr
- 4794 Rubes Creek Dr
- 4798 Rubes Creek Dr
- 2978 Treeside Terrace
- 2900 Treeside Terrace
- 2923 Treeside Terrace
- 2907 Treeside Terrace
- 2904 Treeside Terrace
- 2903 Treeside Terrace
- 4793 Jamerson Forest Pkwy
- 4740 Jamerson Forest Pkwy Unit 165
- 4740 Jamerson Forest Pkwy
- 4789 Rubes Creek Dr Unit 5
- 4741 Jamerson Forest Pkwy