Estimated Value: $734,000 - $1,051,513
4
Beds
4
Baths
3,647
Sq Ft
$257/Sq Ft
Est. Value
About This Home
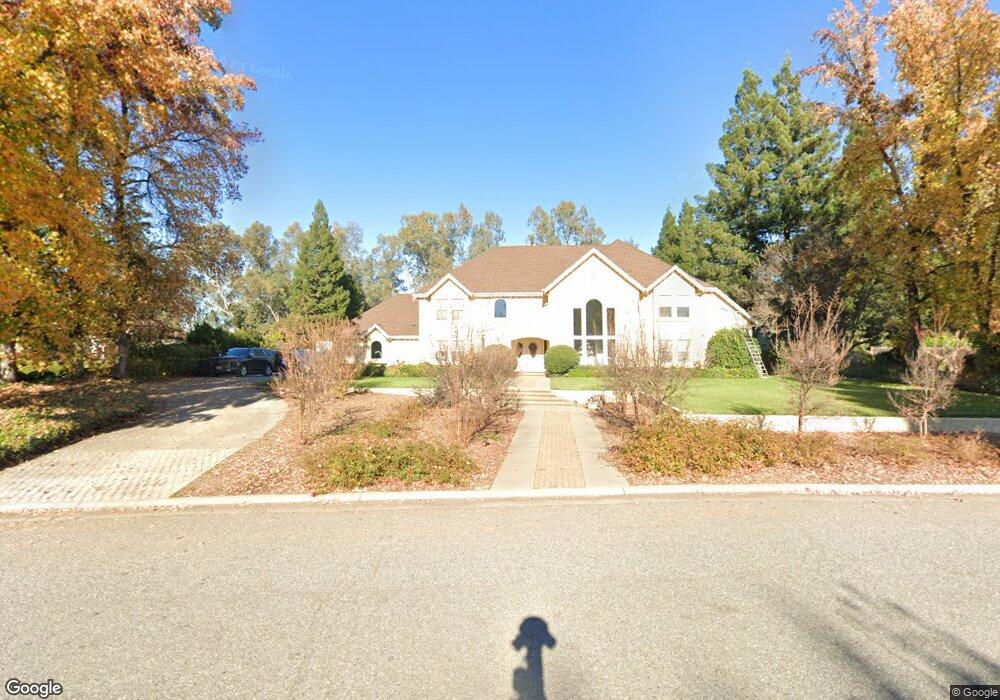
This home is located at 4776 Songbird, Chico, CA 95973 and is currently estimated at $938,628, approximately $257 per square foot. 4776 Songbird is a home located in Butte County with nearby schools including Shasta Elementary School, Bidwell Junior High School, and Pleasant Valley High School.
Ownership History
Date
Name
Owned For
Owner Type
Purchase Details
Closed on
Nov 17, 2022
Sold by
Boelman George D and Boelman Renee G
Bought by
George Dee Boleman and George Renee Gisele
Current Estimated Value
Purchase Details
Closed on
Jun 28, 1999
Sold by
Thompson Craig D and Thompson Rebecca B
Bought by
Boelman George D and Boelman Renee G
Home Financials for this Owner
Home Financials are based on the most recent Mortgage that was taken out on this home.
Original Mortgage
$227,625
Interest Rate
7.24%
Purchase Details
Closed on
Sep 25, 1997
Sold by
Vail William D and Vail Mary Catherine
Bought by
Thompson Craig D and Thompson Rebecca B
Home Financials for this Owner
Home Financials are based on the most recent Mortgage that was taken out on this home.
Original Mortgage
$214,600
Interest Rate
7.44%
Create a Home Valuation Report for This Property
The Home Valuation Report is an in-depth analysis detailing your home's value as well as a comparison with similar homes in the area
Home Values in the Area
Average Home Value in this Area
Purchase History
| Date | Buyer | Sale Price | Title Company |
|---|---|---|---|
| George Dee Boleman | -- | -- | |
| Boelman George D | $303,500 | Bidwell Title & Escrow Compa | |
| Thompson Craig D | $279,500 | Mid Valley Title & Escrow Co |
Source: Public Records
Mortgage History
| Date | Status | Borrower | Loan Amount |
|---|---|---|---|
| Previous Owner | Boelman George D | $227,625 | |
| Previous Owner | Thompson Craig D | $214,600 | |
| Closed | Boelman George D | $45,525 |
Source: Public Records
Tax History Compared to Growth
Tax History
| Year | Tax Paid | Tax Assessment Tax Assessment Total Assessment is a certain percentage of the fair market value that is determined by local assessors to be the total taxable value of land and additions on the property. | Land | Improvement |
|---|---|---|---|---|
| 2025 | $7,261 | $654,624 | $127,561 | $527,063 |
| 2024 | $7,261 | $641,789 | $125,060 | $516,729 |
| 2023 | $7,176 | $629,206 | $122,608 | $506,598 |
| 2022 | $7,063 | $616,869 | $120,204 | $496,665 |
| 2021 | $6,933 | $604,775 | $117,848 | $486,927 |
| 2020 | $6,914 | $598,575 | $116,640 | $481,935 |
| 2019 | $6,692 | $586,839 | $114,353 | $472,486 |
| 2018 | $6,571 | $575,333 | $112,111 | $463,222 |
| 2017 | $6,437 | $564,053 | $109,913 | $454,140 |
| 2016 | $5,882 | $552,994 | $107,758 | $445,236 |
| 2015 | $5,863 | $544,689 | $106,140 | $438,549 |
| 2014 | $5,739 | $534,020 | $104,061 | $429,959 |
Source: Public Records
Map
Nearby Homes
- 34 Covey Ct
- 11 Hawk Place
- 14450 Meridian Rd
- 13966 Carriage Estates Way
- 14805 Hwy 99
- 14805 Us-99
- 13962 Lindbergh Cir
- 4301 Stable Ln
- 63 Our Way
- 14034 Limousin Dr
- 4298 Keith Ln
- 55 Roseanna Ct
- 4269 Keith Ln
- 24 Roseanna Ct
- 10 Roseanna Ct
- 4980 Will T Rd
- 13951 Caribbean Way
- 0 Leftout Ln
- 0 Garner Ln
- 14588 Hamilton Nord Cana Hwy