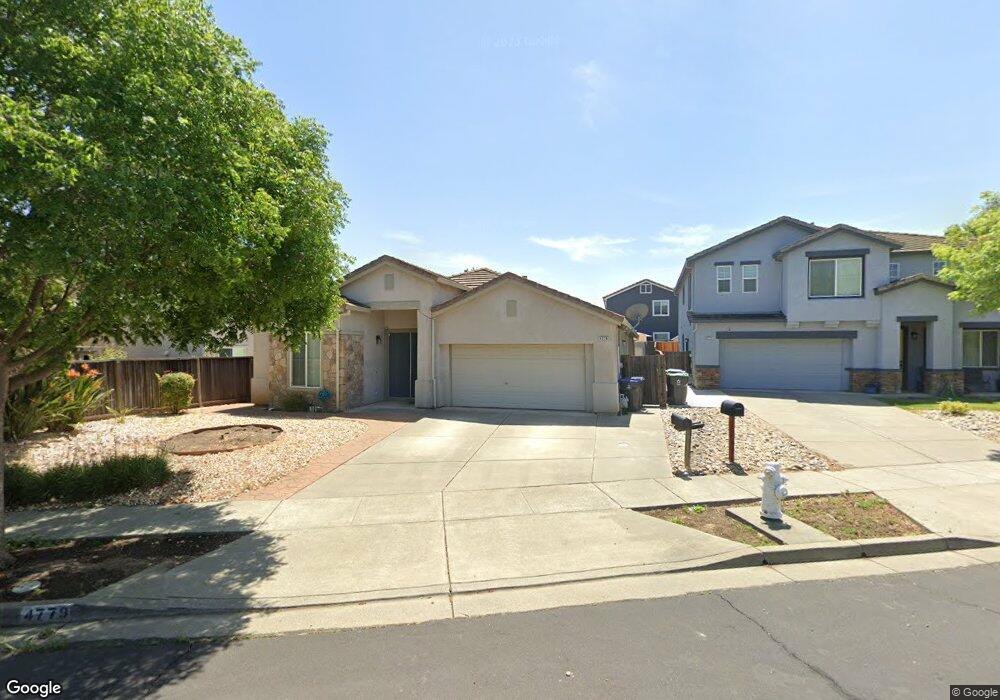
4779 Summerset Dr Fairfield, CA 94534
Estimated Value: $606,000 - $654,000
3
Beds
2
Baths
1,845
Sq Ft
$337/Sq Ft
Est. Value
About This Home
This home is located at 4779 Summerset Dr, Fairfield, CA 94534 and is currently estimated at $621,268, approximately $336 per square foot. 4779 Summerset Dr is a home located in Solano County with nearby schools including Cordelia Hills Elementary School, Green Valley Middle School, and Angelo Rodriguez High School.
Ownership History
Date
Name
Owned For
Owner Type
Purchase Details
Closed on
Apr 14, 2025
Sold by
Rice David E
Bought by
Rice Family Trust and Rice
Current Estimated Value
Purchase Details
Closed on
Feb 11, 2013
Sold by
Ricafort Clifford S and Ricafort Lyzette C
Bought by
Rice David E
Purchase Details
Closed on
Jul 26, 2005
Sold by
Ricafort Clifford S and Ricafort Lyzette C
Bought by
Ricafort Clifford S and Ricafort Lyzette C
Home Financials for this Owner
Home Financials are based on the most recent Mortgage that was taken out on this home.
Original Mortgage
$392,000
Interest Rate
5.75%
Mortgage Type
Purchase Money Mortgage
Purchase Details
Closed on
Mar 14, 2003
Sold by
Albert D Seeno Construction Co
Bought by
Ricafort Clifford S and Ricafort Lyzette C
Home Financials for this Owner
Home Financials are based on the most recent Mortgage that was taken out on this home.
Original Mortgage
$317,050
Interest Rate
5.82%
Create a Home Valuation Report for This Property
The Home Valuation Report is an in-depth analysis detailing your home's value as well as a comparison with similar homes in the area
Home Values in the Area
Average Home Value in this Area
Purchase History
| Date | Buyer | Sale Price | Title Company |
|---|---|---|---|
| Rice Family Trust | -- | None Listed On Document | |
| Rice David E | $240,000 | Old Republic Title Company | |
| Ricafort Clifford S | -- | First American Title Co | |
| Ricafort Clifford S | $352,500 | Frontier Title Co |
Source: Public Records
Mortgage History
| Date | Status | Borrower | Loan Amount |
|---|---|---|---|
| Previous Owner | Ricafort Clifford S | $392,000 | |
| Previous Owner | Ricafort Clifford S | $317,050 |
Source: Public Records
Tax History Compared to Growth
Tax History
| Year | Tax Paid | Tax Assessment Tax Assessment Total Assessment is a certain percentage of the fair market value that is determined by local assessors to be the total taxable value of land and additions on the property. | Land | Improvement |
|---|---|---|---|---|
| 2025 | $3,624 | $295,531 | $73,880 | $221,651 |
| 2024 | $3,624 | $289,737 | $72,432 | $217,305 |
| 2023 | $3,501 | $284,057 | $71,012 | $213,045 |
| 2022 | $3,464 | $278,488 | $69,620 | $208,868 |
| 2021 | $3,413 | $273,028 | $68,255 | $204,773 |
| 2020 | $3,558 | $270,230 | $67,556 | $202,674 |
| 2019 | $3,454 | $264,932 | $66,232 | $198,700 |
| 2018 | $3,550 | $259,738 | $64,934 | $194,804 |
| 2017 | $3,576 | $254,646 | $63,661 | $190,985 |
| 2016 | $3,551 | $249,654 | $62,413 | $187,241 |
| 2015 | $3,357 | $245,905 | $61,476 | $184,429 |
| 2014 | $3,332 | $241,089 | $60,272 | $180,817 |
Source: Public Records
Map
Nearby Homes
- 4763 Summerset Dr
- 1946 Leaning Oak Ct
- 1756 Fawn Glen Cir
- 2197 Yellow Rose Cir
- 1678 Autumnwood Ct
- 1813 Holsteiner Dr
- 4732 Opus Cir
- 824 Crescendo St
- 840 Crescendo St
- 848 Crescendo St
- The Bolero Plan at Cadence at Gold Hill
- The Dulcian Plan at Cadence at Gold Hill
- The Entrata Plan at Cadence at Gold Hill
- The Cornet Plan at Cadence at Gold Hill
- The Adagio Plan at Cadence at Gold Hill
- 5001 Lakeview Cir
- 4927 Claremont Ct
- 4881 Regency Place
- 828 Stoneridge Cir
- 680 Silver Lake Dr
- 4775 Summerset Dr
- 1935 Hummingbird Dr
- 1942 Bramblewood Ct
- 1931 Hummingbird Dr
- 1939 Hummingbird Dr
- 1943 Hummingbird Dr
- 1946 Bramblewood Ct
- 4780 Summerset Dr
- 4784 Summerset Dr
- 4776 Summerset Dr
- 1947 Hummingbird Dr
- 4771 Summerset Dr
- 4788 Summerset Dr
- 1950 Bramblewood Ct
- 4792 Summerset Dr
- 4796 Summerset Dr
- 1951 Hummingbird Dr
- 1934 Hummingbird Dr
- 1938 Hummingbird Dr