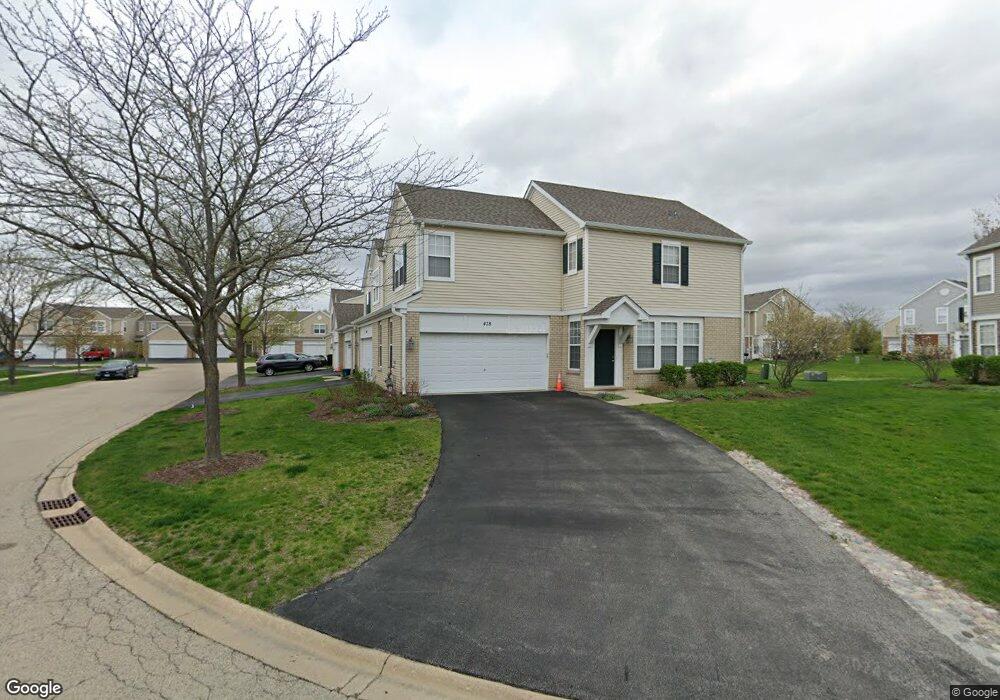
478 Brookside Dr Unit 20 Oswego, IL 60543
North Oswego NeighborhoodEstimated Value: $280,000 - $308,000
3
Beds
3
Baths
1,602
Sq Ft
$180/Sq Ft
Est. Value
About This Home
This home is located at 478 Brookside Dr Unit 20, Oswego, IL 60543 and is currently estimated at $288,234, approximately $179 per square foot. 478 Brookside Dr Unit 20 is a home located in Kendall County with nearby schools including Long Beach Elementary School, Plank Junior High School, and Oswego East High School.
Ownership History
Date
Name
Owned For
Owner Type
Purchase Details
Closed on
May 21, 2018
Sold by
Vossel Caryn A
Bought by
Li Caixing
Current Estimated Value
Home Financials for this Owner
Home Financials are based on the most recent Mortgage that was taken out on this home.
Original Mortgage
$120,000
Outstanding Balance
$87,836
Interest Rate
4.5%
Mortgage Type
Future Advance Clause Open End Mortgage
Estimated Equity
$200,398
Purchase Details
Closed on
Jun 7, 2007
Sold by
Akbar Khalid
Bought by
Vossel Caryn A
Home Financials for this Owner
Home Financials are based on the most recent Mortgage that was taken out on this home.
Original Mortgage
$189,850
Interest Rate
6.2%
Mortgage Type
Purchase Money Mortgage
Purchase Details
Closed on
Oct 1, 2004
Sold by
Centex Homes
Bought by
Akbar Kahlid
Home Financials for this Owner
Home Financials are based on the most recent Mortgage that was taken out on this home.
Original Mortgage
$158,216
Interest Rate
4.87%
Mortgage Type
Purchase Money Mortgage
Create a Home Valuation Report for This Property
The Home Valuation Report is an in-depth analysis detailing your home's value as well as a comparison with similar homes in the area
Home Values in the Area
Average Home Value in this Area
Purchase History
| Date | Buyer | Sale Price | Title Company |
|---|---|---|---|
| Li Caixing | $184,000 | Fidelity National Title | |
| Vossel Caryn A | $190,000 | Law Title Insurance | |
| Akbar Kahlid | $167,000 | Chicago Title Insurance Co |
Source: Public Records
Mortgage History
| Date | Status | Borrower | Loan Amount |
|---|---|---|---|
| Open | Li Caixing | $120,000 | |
| Previous Owner | Vossel Caryn A | $189,850 | |
| Previous Owner | Akbar Kahlid | $158,216 |
Source: Public Records
Tax History
| Year | Tax Paid | Tax Assessment Tax Assessment Total Assessment is a certain percentage of the fair market value that is determined by local assessors to be the total taxable value of land and additions on the property. | Land | Improvement |
|---|---|---|---|---|
| 2024 | $6,562 | $81,547 | $16,237 | $65,310 |
| 2023 | $5,984 | $70,910 | $14,119 | $56,791 |
| 2022 | $5,984 | $66,271 | $13,195 | $53,076 |
| 2021 | $5,795 | $61,936 | $12,332 | $49,604 |
| 2020 | $5,682 | $60,132 | $11,973 | $48,159 |
| 2019 | $5,637 | $58,729 | $11,973 | $46,756 |
| 2018 | $4,866 | $50,051 | $10,204 | $39,847 |
| 2017 | $4,729 | $46,130 | $9,405 | $36,725 |
| 2016 | $3,738 | $41,936 | $8,550 | $33,386 |
| 2015 | $3,430 | $37,443 | $7,634 | $29,809 |
| 2014 | -- | $35,324 | $7,202 | $28,122 |
| 2013 | -- | $38,395 | $7,828 | $30,567 |
Source: Public Records
Map
Nearby Homes
- 303 Springbrook Trail S Unit 1
- 309 Springbrook Trail S
- 410 Manchester Rd
- 0000 Fifth St
- 502 Vernon Dr
- 2071 Wiesbrook Dr
- 313 Kensington Dr
- 207 Long Beach Rd
- 623 Queen Dr
- 209 Huntington Ct
- 786 Bohannon Cir
- 307 Huntington Ct
- 790 Bohannon Cir
- 34 Sonora Dr
- 225 Mondovi Dr
- 162 Heathgate Rd
- 122 Longbeach Rd
- 121 Preakness Dr
- 628 Ebony Dr
- 810 Georgetown Dr
- 478 Brookside Dr
- 476 Brookside Dr
- 488 Brookside Dr
- 474 Brookside Dr Unit 1
- 474 Brookside Dr Unit 474
- 490 Brookside Dr Unit 1
- 470 Brookside Dr
- 492 Brookside Dr
- 485 Brookside Dr
- 485 Brookside Dr Unit 485
- 483 Brookside Dr
- 487 Brookside Dr
- 477 Brookside Dr
- 475 Brookside Dr
- 479 Brookside Dr
- 473 Brookside Dr
- 489 Brookside Dr
- 494 Brookside Dr Unit 1
- 481 Brookside Dr
- 468 Brookside Dr
Your Personal Tour Guide
Ask me questions while you tour the home.